OpenLuup unavailable
-
The latest development v21.3.18 has added a little log analysis tool to the log console pages. It shows the maximum gap between log entries and the time at which that ocurred. In normal operation this should be less than 120 seconds (since openLuup writes cpu and memory statistics at that rate.)
Should make it easier to spot any large breaks in the logs (obviously not if the entire system is frozen!)
-
I had the same crash this night. This time it became unavailable at 03:51.
Last night I reinstalled the two Tasmota sensors I added before the crash so that they have the same Tasmota release as the older sensor that I had for the initial tests when it did not crash. This made no difference, so I can rule that one out.
When looking in the log file from before the crash it looks very similar:
021-03-19 03:51:48.344   openLuup.io.server:: HTTP:3480 connection closed openLuup.server.receive closed tcp{client}: 0x55b6338f7778
2021-03-19 03:51:48.344   openLuup.io.server:: HTTP:3480 connection closed openLuup.server.receive closed tcp{client}: 0x55b6348fa9a8
2021-03-19 03:51:48.344   openLuup.io.server:: HTTP:3480 connection closed openLuup.server.receive closed tcp{client}: 0x55b63427b0d8
2021-03-19 03:51:48.344   openLuup.io.server:: HTTP:3480 connection closed openLuup.server.receive closed tcp{client}: 0x55b634b6da68
2021-03-19 03:51:48.344   openLuup.io.server:: HTTP:3480 connection closed openLuup.server.receive closed tcp{client}: 0x55b632a24e88
2021-03-19 03:51:48.344   openLuup.io.server:: HTTP:3480 connection closed openLuup.server.receive closed tcp{client}: 0x55b63443ef78
2021-03-19 03:51:48.348   openLuup.io.server:: MQTT:1883 connection closed  tcp{client}: 0x55b633f49218
2021-03-19 03:51:48.348   openLuup.mqtt:: closed tcp{client}: 0x55b633f49218
2021-03-19 03:51:48.348   openLuup.mqtt:: tasmota_test UNSUBSCRIBE from cmnd/tasmota_test_fb/# tcp{client}: 0x55b633f49218
2021-03-19 03:51:48.348   openLuup.mqtt:: tasmota_test UNSUBSCRIBE from cmnd/tasmota_test/# tcp{client}: 0x55b633f49218
2021-03-19 03:51:48.348   openLuup.mqtt:: tasmota_test UNSUBSCRIBE from cmnd/tasmotas/# tcp{client}: 0x55b633f49218
2021-03-19 03:51:48.348   openLuup.mqtt:: ERROR publishing application message for mqtt:cmnd/tasmota_test/POWER : closed
At 08:38 it crashed again, this is the first time it has crashed so soon again:
21-03-19 08:38:41.016   openLuup.server:: GET /data_request?id=lu_action&DeviceNum=192&id=variableset&serviceId=urn:micasaverde-com:serviceId:HumiditySensor1&Variable=CurrentLevel&Value=39.4 HTTP/1.1 tcp{client}: 0x55beb3bcdbd8
2021-03-19 08:38:41.016   openLuup.server:: GET /data_request?id=lu_action&DeviceNum=164&id=variableset&serviceId=urn:upnp-org:serviceId:TemperatureSensor1&Variable=CurrentTemperature&Value=-2.1 HTTP/1.1 tcp{client}: 0x55beb3da8618
2021-03-19 08:38:41.016   luup.variable_set:: 192.urn:micasaverde-com:serviceId:HumiditySensor1.CurrentLevel was: 38.6 now: 39.4 #hooks:0
2021-03-19 08:38:41.016   openLuup.server:: request completed (2 bytes, 1 chunks, 0 ms) tcp{client}: 0x55beb3bcdbd8
2021-03-19 08:38:41.016   luup.variable_set:: 164.urn:upnp-org:serviceId:TemperatureSensor1.CurrentTemperature was: -2.1 now: -2.1 #hooks:0
2021-03-19 08:38:41.017   openLuup.server:: request completed (2 bytes, 1 chunks, 0 ms) tcp{client}: 0x55beb3da8618
2021-03-19 08:38:41.022   openLuup.io.server:: MQTT:1883 connection closed  tcp{client}: 0x55beb3c83ca8
2021-03-19 08:38:41.022   openLuup.mqtt:: closed tcp{client}: 0x55beb3c83ca8
2021-03-19 08:38:41.022   openLuup.mqtt:: TasmotaCO2An UNSUBSCRIBE from cmnd/TasmotaCO2An_fb/# tcp{client}: 0x55beb3c83ca8
2021-03-19 08:38:41.022   openLuup.mqtt:: TasmotaCO2An UNSUBSCRIBE from cmnd/tasmotas/# tcp{client}: 0x55beb3c83ca8
2021-03-19 08:38:41.022   openLuup.mqtt:: TasmotaCO2An UNSUBSCRIBE from cmnd/TasmotaCO2An/# tcp{client}: 0x55beb3c83ca8
2021-03-19 08:38:41.022   openLuup.mqtt:: ERROR publishing application message for mqtt:cmnd/TasmotaCO2An/POWER : closed
I have also checked the log analysis tool and could see one device that was often very slow. This is temp data from a Shelly Uni brought in with Sitesensor. I notised the Shelly being very slow also when accessing via the webpage.
I could see the following in the log file just before the the first crash:
# lines: 1214, maximum gap: 42.646s @ 2021-03-19 03:51:46.785

2021-03-19 03:51:04.137   luup.variable_set:: 206.urn:toggledbits-com:serviceId:SiteSensor1.LastRun was: 1616121064 now: 1616122264 #hooks:0
2021-03-19 03:51:04.137   luup.variable_set:: 206.urn:toggledbits-com:serviceId:SiteSensor1.LastQuery was: 1616121064 now: 1616122264 #hooks:0
2021-03-19 03:51:04.137   luup.variable_set:: 206.urn:toggledbits-com:serviceId:SiteSensor1.LastEval was: 1616121064 now: 1616122264 #hooks:0
2021-03-19 03:51:04.137   luup.variable_set:: 206.urn:toggledbits-com:serviceId:SiteSensor1.Message was: Last query OK now: Requesting JSON... #hooks:0
2021-03-19 03:51:04.137   luup_log:206: SiteSensor: Requesting JSON data
2021-03-19 03:51:04.137   luup.variable_set:: 206.urn:toggledbits-com:serviceId:SiteSensor1.LogCapture was: 03:31:04: SiteSensor: Requesting JSON data|03:31:04: SiteSensor: "GET" "http://192.168.1.31/status", headers={  }|0... now: 03:51:04: SiteSensor: Requesting JSON data #hooks:0
2021-03-19 03:51:04.138   luup_log:206: SiteSensor: "GET" "http://192.168.1.31/status", headers={  }
2021-03-19 03:51:04.138   luup.variable_set:: 206.urn:toggledbits-com:serviceId:SiteSensor1.LogCapture was: 03:51:04: SiteSensor: Requesting JSON data now: 03:51:04: SiteSensor: Requesting JSON data|03:51:04: SiteSensor: "GET" "http://192.168.1.31/status", headers={  } #hooks:0
2021-03-19 03:51:46.785   luup_log:206: SiteSensor: Response is 908 bytes in "/tmp/Q_SiteSensor_206.txt"
2021-03-19 03:51:46.785   luup.variable_set:: 206.urn:toggledbits-com:serviceId:SiteSensor1.LogCapture was: 03:51:04: SiteSensor: Requesting JSON data|03:51:04: SiteSensor: "GET" "http://192.168.1.31/status", headers={  } now: 03:51:04: SiteSensor: Requesting JSON data|03:51:04: SiteSensor: "GET" "http://192.168.1.31/status", headers={  }|0... #hooks:0
2021-03-19 03:51:46.786   luup.variable_set:: 206.urn:toggledbits-com:serviceId:SiteSensor1.Message was: Requesting JSON... now: Parsing response... #hooks:0
2021-03-19 03:51:46.787   luup.set_failure:: status = 0
2021-03-19 03:51:46.787   luup.variable_set:: 206.urn:micasaverde-com:serviceId:HaDevice1.CommFailure was: 0 now: 0 #hooks:0
2021-03-19 03:51:46.787   luup.variable_set:: 206.urn:micasaverde-com:serviceId:HaDevice1.CommFailureTime was: 0 now: 0 #hooks:0
2021-03-19 03:51:46.787   luup.variable_set:: 206.urn:toggledbits-com:serviceId:SiteSensor1.Message was: Parsing response... now: Retrieving last response... #hooks:0
2021-03-19 03:51:46.788   luup_log:206: SiteSensor: Eval #1: "response.ext_temperature[\"0\"].tC"=(number)24.44
2021-03-19 03:51:46.788   luup.variable_set:: 206.urn:toggledbits-com:serviceId:SiteSensor1.LogCapture was: 03:51:04: SiteSensor: Requesting JSON data|03:51:04: SiteSensor: "GET" "http://192.168.1.31/status", headers={  }|0... now: 03:51:04: SiteSensor: Requesting JSON data|03:51:04: SiteSensor: "GET" "http://192.168.1.31/status", headers={  }|0... #hooks:0
It was again very slow just before the second crash:
# lines: 1598, maximum gap: 46.871s @ 2021-03-19 08:38:34.554

2021-03-19 08:37:47.682   luup_log:206: SiteSensor: "GET" "http://192.168.1.31/status", headers={  }
2021-03-19 08:37:47.682   luup.variable_set:: 206.urn:toggledbits-com:serviceId:SiteSensor1.LogCapture was: 08:37:47: SiteSensor: Requesting JSON data now: 08:37:47: SiteSensor: Requesting JSON data|08:37:47: SiteSensor: "GET" "http://192.168.1.31/status", headers={  } #hooks:0
2021-03-19 08:38:34.554   luup_log:206: SiteSensor: Request returned no data, status 500
2021-03-19 08:38:34.554   luup.variable_set:: 206.urn:toggledbits-com:serviceId:SiteSensor1.LogCapture was: 08:37:47: SiteSensor: Requesting JSON data|08:37:47: SiteSensor: "GET" "http://192.168.1.31/status", headers={  } now: 08:37:47: SiteSensor: Requesting JSON data|08:37:47: SiteSensor: "GET" "http://192.168.1.31/status", headers={  }|0... #hooks:0
2021-03-19 08:38:34.554   luup.variable_set:: 206.urn:toggledbits-com:serviceId:SiteSensor1.Failed was: 0 now: 1 #hooks:0
2021-03-19 08:38:34.554   luup.variable_set:: 206.urn:toggledbits-com:serviceId:SiteSensor1.FailedSince was:  now: 1616139514 #hooks:0
2021-03-19 08:38:34.554   luup.variable_set:: 206.urn:toggledbits-com:serviceId:SiteSensor1.LastFail was: 1616052193 now: 1616139514 #hooks:0
2021-03-19 08:38:34.555   luup.set_failure:: status = 1
2021-03-19 08:38:34.555   luup.variable_set:: 206.urn:micasaverde-com:serviceId:HaDevice1.CommFailure was: 0 now: 1 #hooks:0
2021-03-19 08:38:34.555   luup.variable_set:: 206.urn:micasaverde-com:serviceId:HaDevice1.CommFailureTime was: 0 now: 1616139514 #hooks:0
2021-03-19 08:38:34.555   luup.variable_set:: 206.urn:micasaverde-com:serviceId:SecuritySensor1.Tripped was: 0 now: 1 #hooks:0
2021-03-19 08:38:34.555   luup.variable_set:: 206.urn:micasaverde-com:serviceId:SecuritySensor1.LastTrip was: 1616052265 now: 1616139514 #hooks:0
2021-03-19 08:38:34.555   luup.variable_set:: 206.urn:micasaverde-com:serviceId:SecuritySensor1.ArmedTripped was: 0 now: 1 #hooks:0
2021-03-19 08:38:34.555   luup.variable_set:: 206.urn:toggledbits-com:serviceId:SiteSensor1.Message was: Requesting JSON... now: Retrieving last response... #hooks:0
2021-03-19 08:38:34.555   luup.variable_set:: 206.urn:toggledbits-com:serviceId:SiteSensor1.Message was: Retrieving last response... now: Last query failed, HTTP status 500 #hooks:0
2021-03-19 08:38:34.555   luup.set_failure:: status = 1
2021-03-19 08:38:34.555   luup.variable_set:: 206.urn:micasaverde-com:serviceId:HaDevice1.CommFailure was: 1 now: 1 #hooks:0
After the second crash I deactivated the Sitesensor fetching this data from the Shelly. At least I have not seen so long delays after that.
I have not yet changed the server backlog.
I will continue to do some testing, but I am not quite sure what I am chasing at the moment.
-
OK, well thanks again for all that. I will take a while to consider this. However, my first suggestion would anyway have been to disable SiteSenso, if at all possible, and see how it goes.
Once again, there is nothing amiss with a break in the log of up to 120s, and, indeed, in my latest edit (internal, as yet) I have disabled the gap warning message unless is exceeds 120 seconds.
@akbooer yes that was my thought also and see how it goes.
Btw I typically have delays of 2-4 seconds. At times a bit longer, those often being Sitesensors or Netmon pinging PCs that are offline.
That Shelly was the one device often being really slow. In fact it is often slow accessing via the browser also.The strange thing is that all the devices have been up and running on my system for a really long time, but maybe adding the Mqtt on top was the last small straw. Strange anyway.
-
You mention a slow Shelly. This should not be a problem, but, again, worth just taking it out of the loop sometime? Why is it 'slow'?
@akbooer I do not fully know. It is a Shelly Uni with two relays and one temp sensor.
I have read so-so reports on the Shelly Uni in fact.
It is situated close to the wifi access point, but I moved it a bit just now and it got better wifi quality numbers.
It is sitting in the midst of the electrical central, could be one reason perhaps.
The idea is to move it to Mqtt for the temp reporting and then it should work better. I turned off that Sitesensor for now to test if it helps anything. -
That's great, thanks. Just to let you know that I am taking this very seriously and I now have a fairly continuous stream of UDP updates going from my VeraLite to three different openLuup systems (Rpi, BeagleBone Black, Synology Docker) via the UDP -> MQTT bridge, with MQTT Explorer running on an iMac subscribed to one or other of those. From time to time the iMac sleeps, so the Explorer disconnects and then later reconnects. All openLuup instances are running the latest v21.3.19 looking for large gaps in the logs (or, indeed, a system freeze.)
So I am stress-testing this as far as I can without having your exact configuration.
-
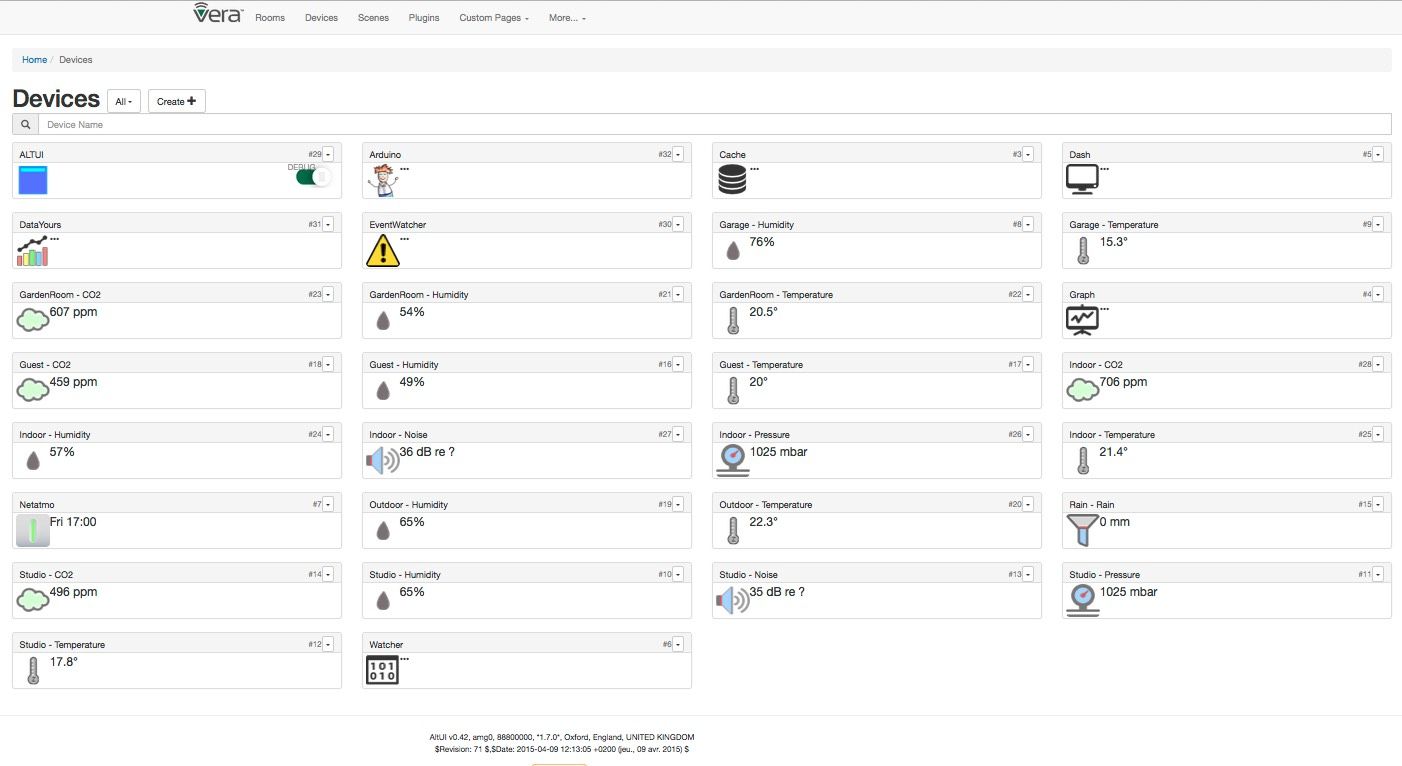
@akbooer I'm running on an an old 2,27x4 GHz Fujitsu i3 Esprimo SFF PC with Ubuntu 18.04.5 and 4GB RAM and a 120 GB SSD.
My Z-way server is on a separate Raspberry Pi 3B+ with a Razberry board. Then one old UI5 Vera Lite and a UI7 Vera Plus, both almost completely offloaded, just a few virtual devices left on them.
-
@akbooer I'm running on an an old 2,27x4 GHz Fujitsu i3 Esprimo SFF PC with Ubuntu 18.04.5 and 4GB RAM and a 120 GB SSD.
My Z-way server is on a separate Raspberry Pi 3B+ with a Razberry board. Then one old UI5 Vera Lite and a UI7 Vera Plus, both almost completely offloaded, just a few virtual devices left on them.
This morning no crash. Not sure which of the changes I made that made the difference. Still good progress and something to continue working from.
This is what I did yesterday:
-
Updated to OpenLuup 21.3.19 from 21.3.18
-
Removed the line
luup.attr_set ("openLuup.MQTT.PublishDeviceStatus", "0")from Lua Startup. I tested reloading without the line and it was not needed anymore as it seems -
Deactivated a few Sitesensors; the slow Shelly Uni, one fetching weather data and three more fetching some local data
-
Deleted two devices from Netmon that does not exist anymore, i.e. never respond to ping
-
Cut the power to my three test Mqtt devices, i.e. no active Mqtt devices reporting anything over Mqtt all night
-
-
Progress indeed. A slow build back should isolate the culprit.
For my part, I’ve spotted a difference in behaviour between my RPi and Docker instances when there’s a network outage, resulting in an error message "no route to host" on the RPi which blocks the system for longer than 2 minutes. Needs further investigation.
-
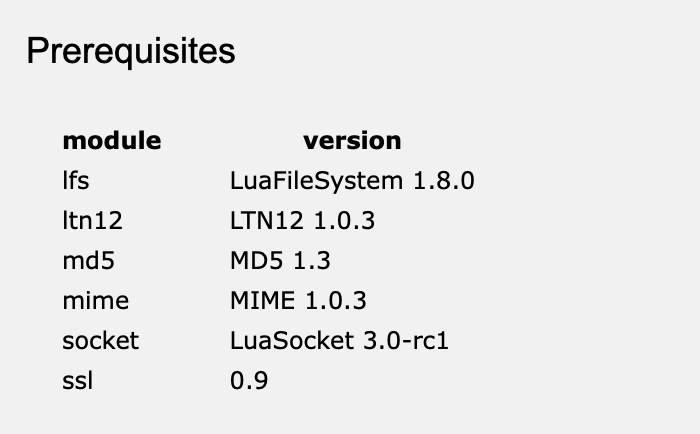
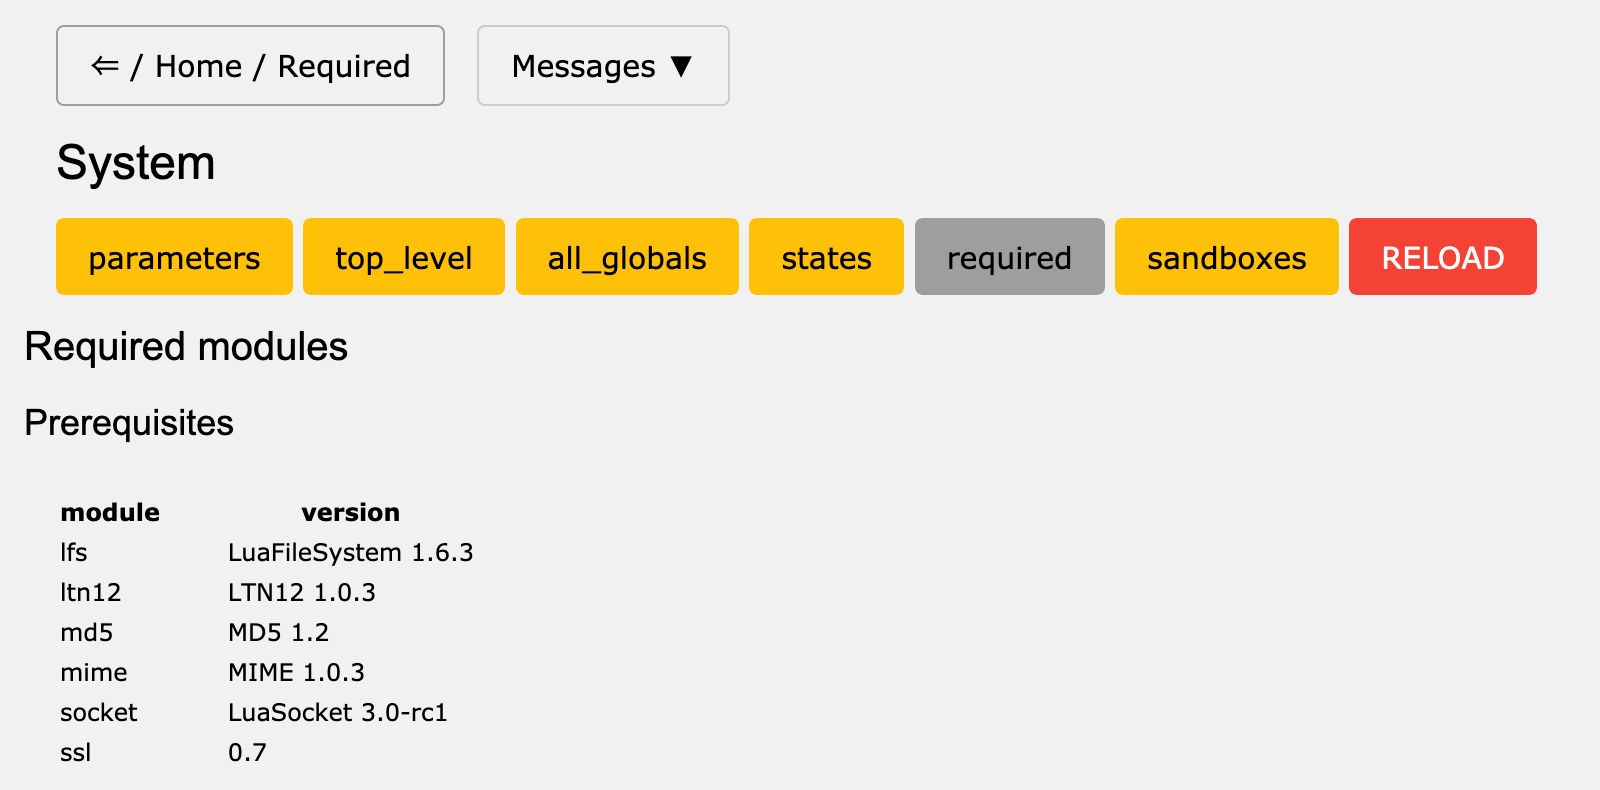
The latest development version v21.3.20 has a new console page openLuup > System > Required which shows key system modules, and also those required by each plugin.
I am seeing some small version differences between my systems, but I don't think this is the issue. I would, nevertheless, be interested in your version of this page:
Incidentally, this system (running in a Docker on my Synology NAS) ran overnight with over 100,000 MQTT messages sent to MQTT Explorer, totalling over 18 Mb of data without any issues at all.
-
This morning no crash either, progress again. This shows that the Mqtt functionality works overnight as such anyway.
What I changed yesterday:
-
updated OpenLuup from 2.3.19 to 2.3.20
-
powered up one of the test Mqtt devices
Next step it to start one of the other devices and see what happens.
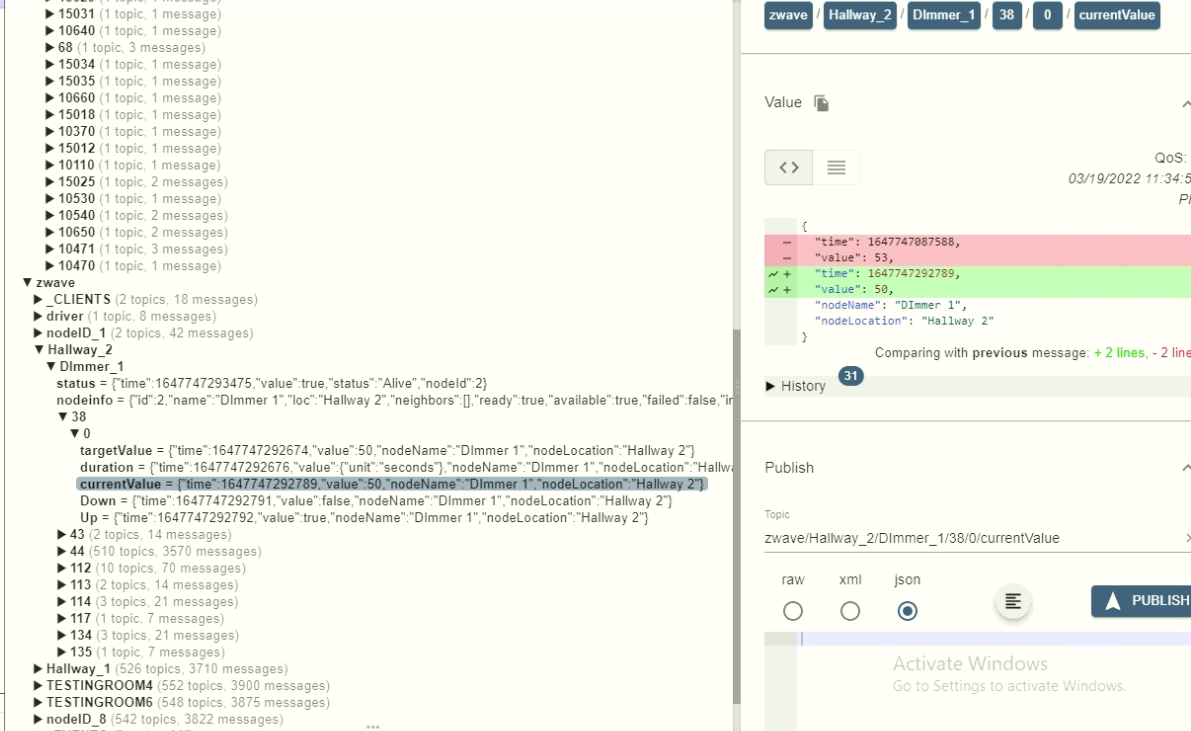
This is what MqttExplorer has logged since yesterday:

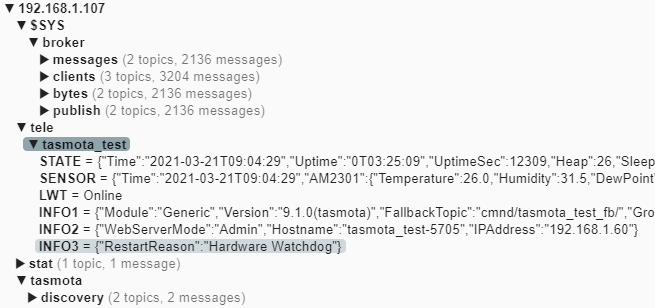
The two topics that the device sends out every 5 minutes:
05:44:29 MQT: tele/tasmota_test/STATE = {"Time":"2021-03-21T05:44:29","Uptime":"0T00:05:09","UptimeSec":309,"Heap":27,"SleepMode":"Dynamic","Sleep":50,"LoadAvg":19,"MqttCount":1,"Wifi":{"AP":1,"SSId":"MyNetwork","BSSId":"FC:EC:DA:D1:7A:64","Channel":11,"RSSI":100,"Signal":-45,"LinkCount":1,"Downtime":"0T00:00:03"}} 05:44:29 MQT: tele/tasmota_test/SENSOR = {"Time":"2021-03-21T05:44:29","AM2301":{"Temperature":26.0,"Humidity":30.9,"DewPoint":7.5},"TempUnit":"C"} -
-
This morning no crash either, progress again. This shows that the Mqtt functionality works overnight as such anyway.
What I changed yesterday:
-
updated OpenLuup from 2.3.19 to 2.3.20
-
powered up one of the test Mqtt devices
Next step it to start one of the other devices and see what happens.
This is what MqttExplorer has logged since yesterday:
The two topics that the device sends out every 5 minutes:
05:44:29 MQT: tele/tasmota_test/STATE = {"Time":"2021-03-21T05:44:29","Uptime":"0T00:05:09","UptimeSec":309,"Heap":27,"SleepMode":"Dynamic","Sleep":50,"LoadAvg":19,"MqttCount":1,"Wifi":{"AP":1,"SSId":"MyNetwork","BSSId":"FC:EC:DA:D1:7A:64","Channel":11,"RSSI":100,"Signal":-45,"LinkCount":1,"Downtime":"0T00:00:03"}} 05:44:29 MQT: tele/tasmota_test/SENSOR = {"Time":"2021-03-21T05:44:29","AM2301":{"Temperature":26.0,"Humidity":30.9,"DewPoint":7.5},"TempUnit":"C"}Yet another morning without a crash, once again some progress.
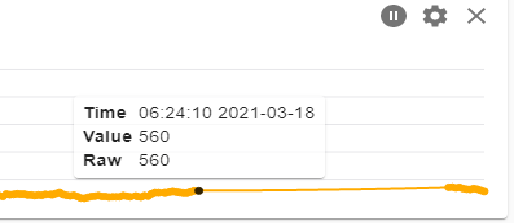
Not so much Mqtt traffic during the last 24 hours:

Just to test my other type of Mqtt test device I did the following yesterday:
-
powered down the Mqtt test device I had up and running
-
powered up the other type Mqtt test device
The one I have had up and running publishes the following every 5 minutes:
08:11:27 MQT: tele/TasmotaCO2An/STATE = {"Time":"2021-03-22T08:11:27","Uptime":"0T22:55:12","UptimeSec":82512,"Heap":22,"SleepMode":"Dynamic","Sleep":50,"LoadAvg":19,"MqttCount":1,"Wifi":{"AP":1,"SSId":"BeachAC","BSSId":"FC:EC:DA:D1:7A:64","Channel":11,"RSSI":74,"Signal":-63,"LinkCount":1,"Downtime":"0T00:00:03"}}
08:11:27 MQT: tele/TasmotaCO2An/SENSOR = {"Time":"2021-03-22T08:11:27","BME280":{"Temperature":20.1,"Humidity":40.4,"DewPoint":6.2,"Pressure":1007.3},"MHZ19B":{"Model":"B","CarbonDioxide":767,"Temperature":43.0},"PressureUnit":"hPa","TempUnit":"C"}
Perhaps a bit overcautios but I wanted to see that the second device works overnight since this type was the one I added last time when the problems started.
Next step I think will be to run my three Mqtt sensors for some time.
-
-
@akbooer I installed v2.3.20, this is what it shows:
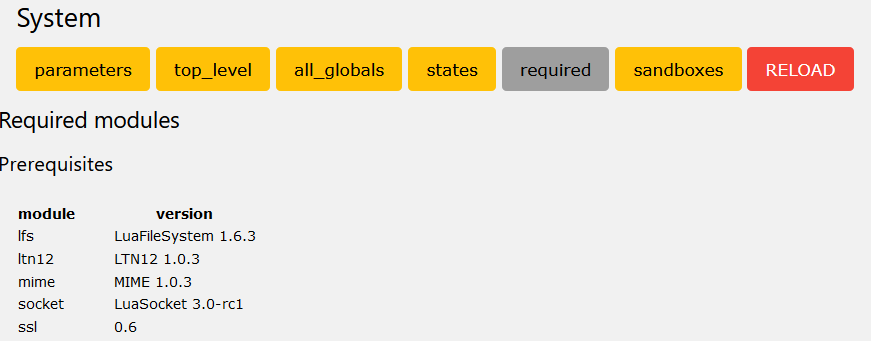
Your data sounds promising.
")
I can add that despite the problems my system still feels really fast when it is up and running. -