Profiling Lua Code
-
Just by way of example, here's the profile of a single line of code (albeit, one that you can't do in Vera) which fetches the entire history of openLuup's memory usage (probably a daily average, assuming you have the Historian enabled – in my case, about two year's worth of data)
local profile = require "miniprofiler"
profile "clear"

profile "on"
local x, t = luup.variable_get ("openLuup", "Memory_Mb", 2, {0, os.time()})
profile "off"

print (profile)
Resulting in the profiler output:
––– 31 lines ––– 35.2 ms ––– 18310 TOTAL Function calls 10960 local (for generator) 7300 global tonumber 7 upvalue time 6 method oldest 3 method read 2 field unformatted_unpack 2 global type 2 ? 2 local fct 2 global ipairs 2 field time 2 upvalue calc_offset 2 field concat 2 method gmatch 2 method seek 1 local profile 1 upvalue Wfetch 1 field timenow 1 method close 1 field variable_get 1 method variable_get 1 upvalue hook 1 field fetch 1 field clear 1 field floor 1 field dsv2filepath 1 method ipairs 1 field open 1 global pcall -
That works. Here is some AES ECB 128 running. Note how often the 8 bit XOR is called! Clearly something you would want optimised (and it is).
782620 TOTAL Function calls 588814 upvalue xor8 76050 field insert 33370 field format 12102 field char 7854 upvalue shiftRowsInverse 7293 upvalue mixColumnsInverse 6194 local (for generator) 5849 field concat 5328 upvalue band 4532 global tostring 3623 global type 2446 upvalue rshift 2375 global ipairs 2145 upvalue p 1680 upvalue shiftRowsForward 1560 upvalue mixColumns 1487 global select 1487 upvalue print 1223 global unpack 1156 field gettime 1107 method match 902 method format 898 field send 898 upvalue write 898 field current_device 898 upvalue formatted_time 898 field date 898 method write 898 field floor 894 upvalue debug 894 field log 818 upvalue tableDump -
I see that xor8 is referenced as an ‘upvalue’. You may be able to access this faster by making it a local reference. Something like...
local xor8 = bit.xor8 -- or wherever it comes fromThis places the reference in one of the virtual machine registers so that it doesn’t have to search up the chain of closures to find it.
I’ve had great success with using this to increase performance of a often-called function (over a million times) on another project I am working on, cutting overall run time to about 60% of the initial value.
YMMV.
-
Further to this:
@a-lurker said in openLuup: Suggestion:
is it possible to somehow profile openLuup to see what is really holding it up.
and this:
@akbooer said in openLuup: Suggestion:
the [debug] library can be slow, so timing is not really possible at the Lua level.
...it occurred to me that openLuup already has the tools you need, at least at the level of plugins (rather than individual functions.)
Each plugin has a dynamic attribute called
cpu(s)with cumulative CPU time to sub-millisecond resolution. Everything you need can be wrapped into a single short function:local function cpu () local array local function sub(a,b) local s, b = array {}, b or {} for n,v in pairs(a) do s[n] = b[n] and v - b[n] or nil end return s end local function str(x) local con = table.concat local time, info = "%8.3f", "%12s %8s %s" local b = {info: format ("(s.ms)", "[#]", "device name")} for n,v in pairs(x) do local name = luup.devices[n].description: match "%s*(.*)" b[#b+1] = info: format (time: format(v), con{'[', n, ']'}, name) end return con (b, '\n') end function array (x) setmetatable (x, {__sub = sub, __tostring = str}) return x end local t = array {} for i, d in pairs (luup.devices) do t[i] = d.attributes["cpu(s)"] end return t endThis returns a table with snapshot of the current
cpu(s)attribute of all plugins.local T = cpu() print (pretty(T))which shows (for my test system):
{nil,0.029998,183.22298999998,0,
  [13] = 14753.573033043,
  [16] = 57.727522,
  [17] = 3020.1334680015,
  [18] = 3721.1430400028,
  [20] = 2054.268114,
  [42] = 11.429613,
  [48] = 13080.996162966,
  [70] = 7731.7173460024
}
...but it's better than that, since you can simply print it and get a nice formatted output:
print "TOTAL plugin time"
print (T)
which looks like this:
 TOTAL plugin time
      (s.ms)      [#] device name
       0.030      [2] openLuup
     183.173      [3] Alternate UI
       0.000      [4] Alternate App Store
   13077.346     [48] Philips hue
    7729.377     [70] Studio hue
      57.728     [16] BBB Sonos (Study)
    3019.473     [17] Vera 0
    3720.243     [18] Vera 1
    2053.798     [20] Netatmo
      11.430     [42] DarkSky Weather
   14749.333     [13] Vera Edge
...but it's even better than that, because you can do math with this object, so calling it again, you can then print the incremental change between the two CPU time snapshots:
local T2 = cpu()
print "Time since last call"
print (T2 - T)
giving:
 Time since last call
      (s.ms)      [#] device name
       0.000      [2] openLuup
       0.030      [3] Alternate UI
       0.000      [4] Alternate App Store
       0.000     [20] Netatmo
       0.640     [17] Vera 0
       2.290     [13] Vera Edge
       1.300     [70] Studio hue
       0.000     [42] DarkSky Weather
       2.370     [48] Philips hue
       0.000     [16] BBB Sonos (Study)
       0.790     [18] Vera 1
At the moment you'll have to copy this function and use it directly, but I'll include it as part of the openLuup extensions in the next release:
local T = luup.openLuup.cpuor something like that.
HTH.
-
Works great - thanks for this. And the top contenders are:
EKM meter plugin
AltUI
AltHue Philips Hue
VeraBridge
Paradox IP150 web page scraper
SMA Inverter
DataYoursEKM meter plugin, which I wrote and uses the 'incoming' stuff on a byte by byte basis - only runs every 30 secs - pathetic. Needs a rewrite: down another rabbit hole. Paradox IP150 web page scraper: another of mine. Runs every second. Been doing a rewrite in the hope of speeding it up but I don't think it will make any difference. SMA Inverter; also mine: runs every 5 mins. Uses UDP with sockets - not too bad. The EKM meter takes up 16 time more time than the SMA inverter.
I went through the openLuup code - I looked and looked - but couldn't find the bit of code where you alter the openLuup time to always be about 1/100,000 of the top contender.

It might be easier to purchase a new RasPi 4 to replace the current RasPi 3- - whoops, I hope it's not listening.
-
These:
- AltUI
- AltHUE
- VeraBridge
...all poll in one way or another, and may well spend time converting to/from JSON. Usual to see larger numbers here. Installing Cjson will help VeraBridge.
The openLuup plugin, itself, runs very rarely. What you’re not seeing is the openLuup system itself, scheduler, Historian, etc., but that is, of course, lightning fast.
-
No, just cereals and OJ on a weekday.
I’m surprised that DataYours makes the list. Although retrieving large amount of data and plotting take time, normal incremental database updates should be fast. You never moved to using the Data Historian? Not a top priority, though.
-
Data Historian? So much stuff and so little time. I should have got a CBUS system and paid for the man to come in when it needed tweaking. Living off muesli with fruit here.
Seriously though, I hoping people will be able to find ways to improve their plugins, based on the info provided in this new report. If it's representative of what's actually going on, it should be useful. However, it may not represent what's causing actual traffic jams ie demand for resources all occurring simultaneously and holding up the scheduling.
@a-lurker said in Profiling Lua Code:
based on the info provided in this new report. If it's representative of what's actually going on, it should be useful.
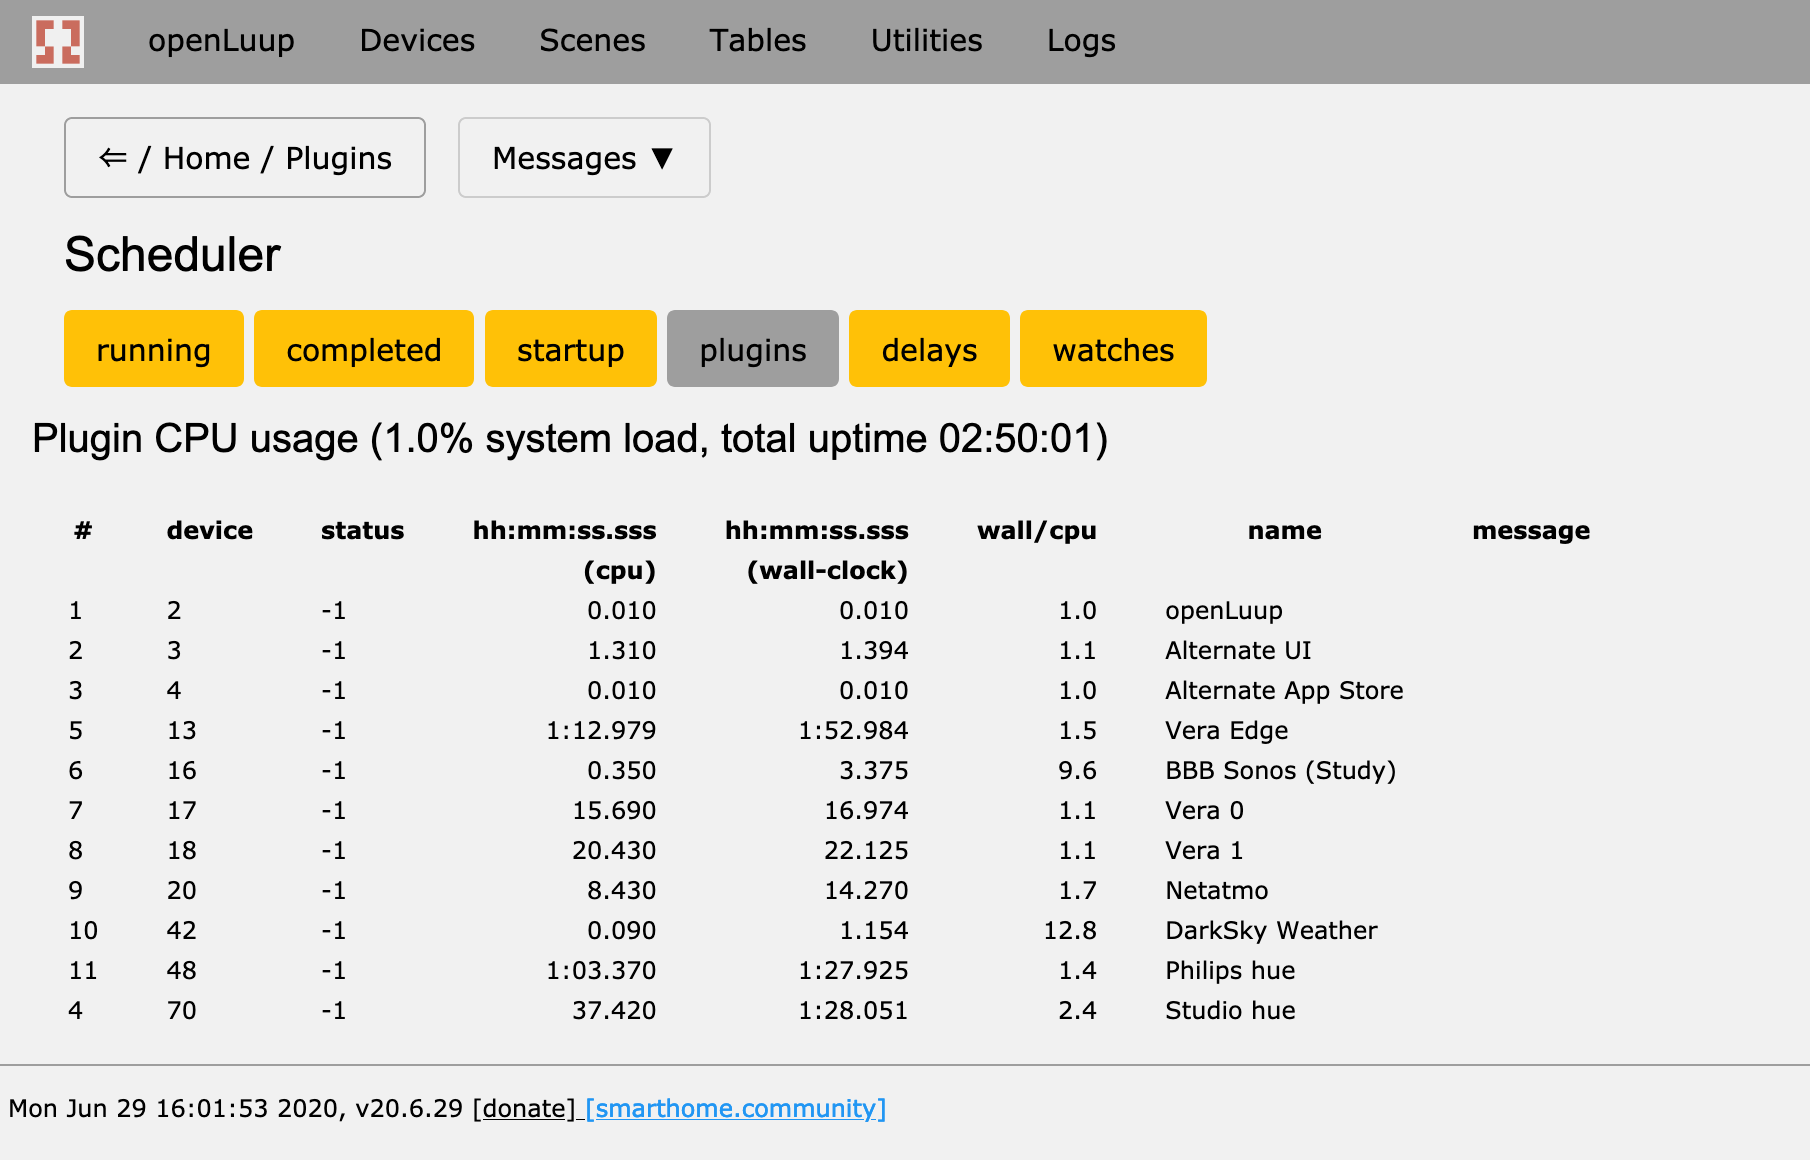
I’ve improved upon it (hopefully) by adding a wall-clock time (per plugin) measurement in the latest development release (v20.6.29). The measurements are as good as I can possibly make them, given the underlying tools (
os.clock(), socket.gettime()) and wrapped directly in thecontext_switch()routine which is the heart of the scheduler.In the example below, for a machine running three VeraBridges, amongst other things, you can see that two of the bridges are running at a ratio of 1.1, whereas the other is 1.5. There's a good reason for this, since that bridge is not using asynchronous HTTP, so wastes time waiting for the synchronous request response. I think that's also true for the AltHue plugin.
Indeed, the numbers are only long(ish)-term averages, and don’t necessarily represent transient hold-ups. I suspect any further diagnostic, like queue length statistics, would become too obscure to be useful.
-
Have tried out the new console Wall clock to CPU clock feature, etc. Very good addition.
So I find that one plugin has a Wall clock to CPU clock ratio of 352.7 to 1.
The plugin monitors the status of a AV device every 30 seconds by sending a HTTP request to the device and gets an XML response containing all the status. Now this AV device is fully powered off most of the day. So the HTTP call times out every 30 seconds (uses a one second request timeout). The plugin uses this to decide if the AV device is powered on or not.
So the question is: do these ongoing and regular timeouts sap resources to any significant degree or not. Likewise will it diminish overall I/O capability. If so, what is the best approach to improving this?
I looked at: http_async.lua but I don't see how it could help in this scenario.
-
If the timeout is on the HTTP request when sent, then async isn’t going to help (as it currently stands.)
Yes, the blocking request will steal one second in every thirty from the entire openLuup system.
Try using PING to test whether the device is up?


