A
Alan_F
@Alan_F
Love openLuup - it just keeps working perfectly.
I started looking at trying to add a gen4 Shelly device to the Shelly plugin via L_ShellyBridge.lua. The plugin is a little uncooked (no rudeness intended), so a bit of a rabbit hole for me.
All of a sudden no console pages available in either Firefox or Chrome. AltUI works perfectly and all the log files indicate no errors. openLuup still running everything works as it should - just no console pages.
I possibly screwed something up but any recently changes files show no problems. The original/ backup of L_ShellyBridge.lua was reinstated but still no console.
Bit stumped on this one. Not sure how to debug. Any ideas?
Build 21228 has been released. Docker images available from DockerHub as usual, and bare-metal packages here.
Home Assistant up to version 2021.8.6 supported; the online version of the manual will now state the current supported versions;
Fix an error in OWMWeatherController that could cause it to stop updating;
Unify the approach to entity filtering on all hub interface classes (controllers); this works for device entities only; it may be extended to other entities later;
Improve error detail in messages for EzloController during auth phase;
Add isRuleSet() and isRuleEnabled() functions to expressions extensions;
Implement set action for lock and passage capabilities (makes them more easily scriptable in some cases);
Fix a place in the UI where 24-hour time was not being displayed.
Hey @toggledbits
One thing that bothers me while doing work on new systems/new features, is that I cannot copy&paste actions, and I cannot drag&drop between set and resets.
#1 is for when I want to copy an action between different rules opened in two separate browser windows, while #2 is when I just need to flip a bunch of actions in the reset, or move some logic back and forth.
Both will be appreciated, but I understand the technical challenges. Thanks!
I'm currently on version 26011. I understand that the aarch64 image is no longer supported. So, I therefore need to update to the ARM64 image. Can anyone possibly suggest how I update my docker compose.yaml file (see below). Ideally I'd like to keep my existing reactions etc. rather than start from scratch.
# Multi-System Reactor template docker-compose.yml (version 22160)
#
# Change the lines indicated by "DO"...
#
services:
reactor:
container_name: reactor
environment:
# DO change the TZ: line to set your local time zone.
# See valid TZ list: https://en.wikipedia.org/wiki/List_of_tz_database_time_zones
TZ: GB
#
# DO NOT change this path. Your directory location is in "source" below.
REACTOR_DATA_PREFIX: /var/reactor
# DO change the image below to the one you are using (e.g. armv7l or aarch64 for RPi 4)
image: toggledbits/reactor:latest-aarch64
restart: "always"
expose:
- 8111
ports:
- 8111:8111
volumes:
# DO change the /home/username/reactor below to the directory you created for
# your local data; DO NOT change the /var/reactor part
- /home/pi/docker/reactor:/var/reactor
- /etc/localtime:/etc/localtime:ro
tmpfs: /tmp
It appears that Ezlo is going to new levels of paid subscription for cloud services supporting Vera hubs. I have to congratulate them. It will soon be 8 years since Ezlo acquired Vera, and despite their purported financial and "intellectual" capital, they have to date not produced a viable full replacement for Vera. Now they are going to charge extra for services for a platform that they stopped updating years ago.
If you know anyone who hasn't yet fully moved on from Captain Ahab's White Whale Chase, please remind them that my Decouple project is still up on Github to decouple a Vera Plus/Secure/Edge from Vera/Ezlo's cloud services. Veras have been said to misbehave when they can't reach the mother ship.
I have also written my first new Vera plugin in... six years? more?... the AlertPushover project will send Vera hub alerts to Pushover, so you can still get messages generated by your Vera hub without paying for Ezlo's cloud service. It's crude but functional (i.e. better than nothing/worth every penny paid).
These two projects won't replace the functionality of their cloud service and app for those who need those things. But any that don't, this may help bridge the gap. Hopefully these stragglers who have waited so long and been disappointed so often will get the idea that it's time to move on.
If you are using the armv7l docker image, the OpenJS Foundation that publishes node is no longer producing 32-bit builds as of v24. That means the last supported LTS version of node for armv7l is v22, which will go End-of-Life in May 2027.
Therefore, the Reactor armv7l image is now deprecated and will only be produced until node v22 goes EOL, and I will not publish armv7l images beyond that date.
If you are running an RPi 3 or earlier with Reactor, you are on this image, and will need to upgrade hardware to a 64-bit model and use the arm64 image. If you need help getting it done, ask in this category.
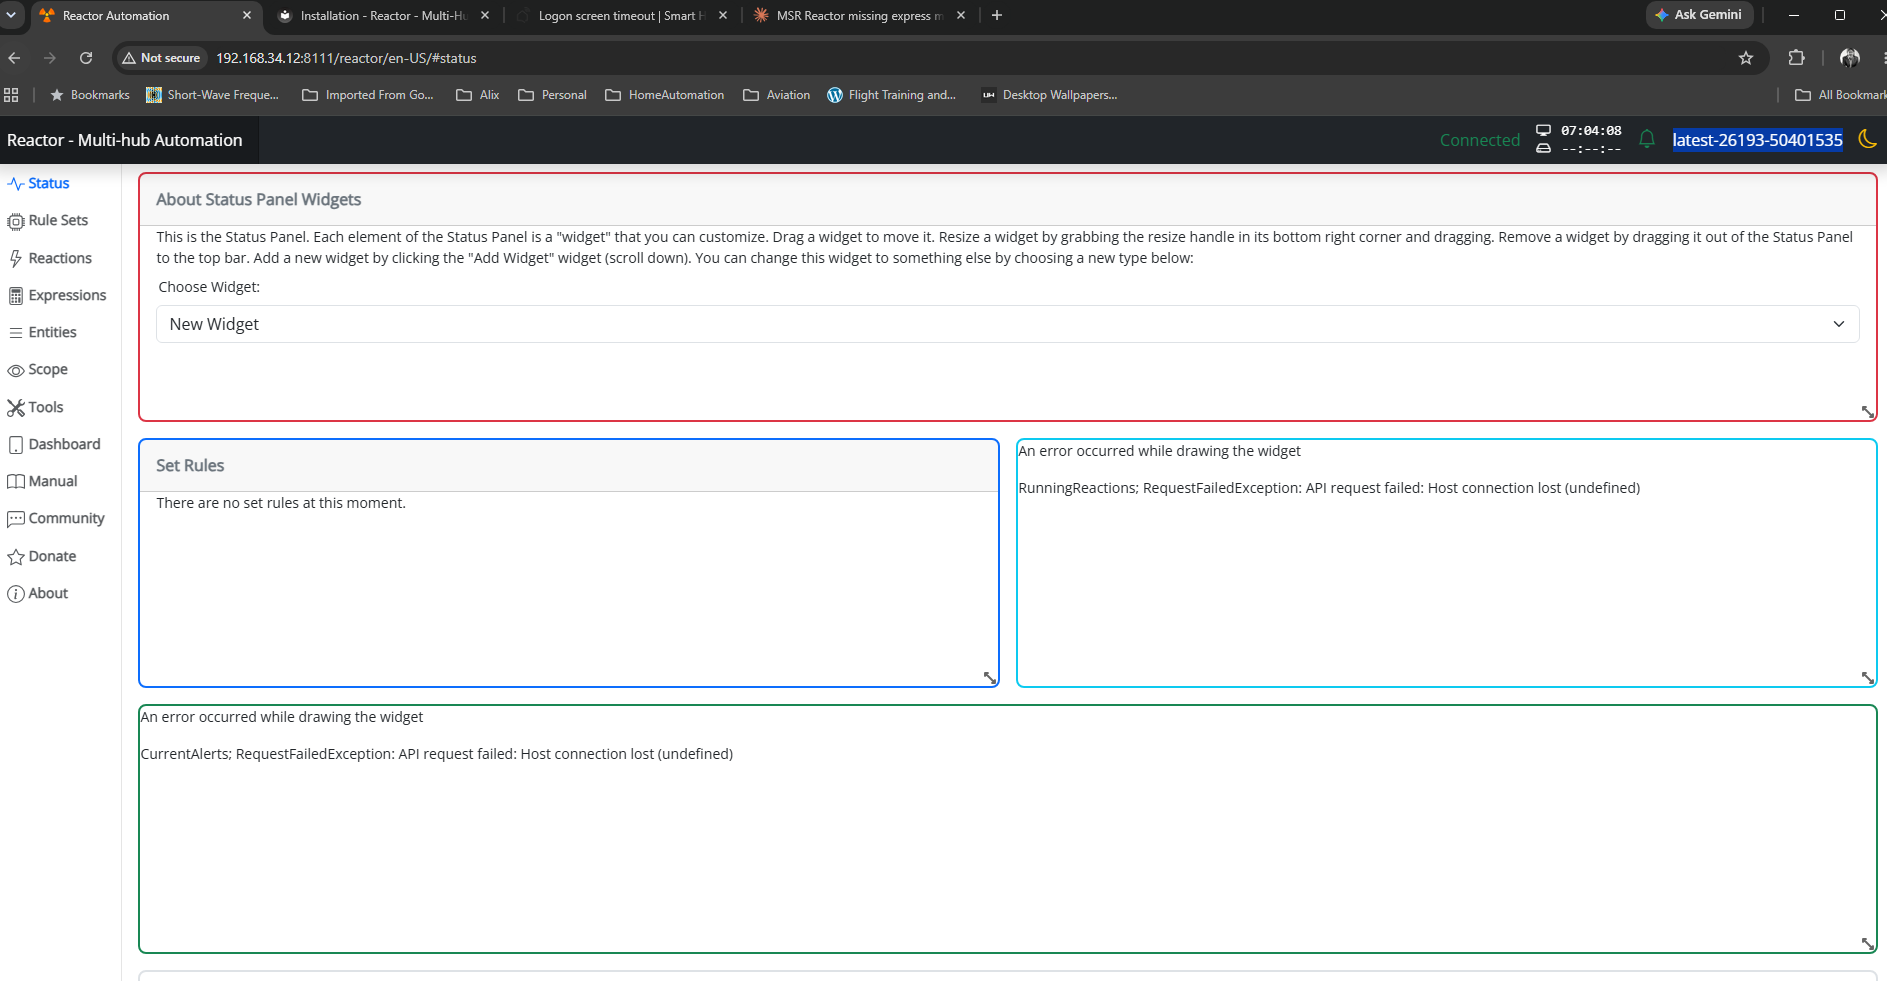
@toggledbits I pulled the image (well, Watchtower did) and within minutes the whole system went offline.
The log looks like it ends with 26143.
[latest-26143]2026-05-31T15:23:44.547Z <default:INFO> Closing container Container#Predicate#rule-mkahsmgf/26qq82mw-cons
[latest-26143]2026-05-31T15:23:44.547Z <default:INFO> Closing container Container#Predicate#rule-lqyfljfi/22f8on0t-cons
[latest-26143]2026-05-31T15:23:44.547Z <default:INFO> Closing container Container#Predicate#rule-lsb61rw8/24oenqi2-cons
[latest-26143]2026-05-31T15:23:44.547Z <default:INFO> Closing container Container#Predicate#rule-lrh58he0/rule-lrh58he0:S-1c00gfib-cons
[latest-26143]2026-05-31T15:23:44.547Z <default:INFO> Closing container Container#Predicate#rule-lrh58he0/1c00dylr-cons
[latest-26143]2026-05-31T15:23:44.547Z <default:INFO> Closing container Container#Predicate#rule-lrh58he0/1nam9w5u-cons
[latest-26143]2026-05-31T15:23:44.547Z <default:INFO> Closing container Container#Predicate#rule-miuh2qqi/22ls4lql-cons
[latest-26143]2026-05-31T15:23:44.547Z <default:INFO> Closing container Container#Predicate#rule-kwc6rmci/rule-kwc6rmci:S-1vj8sdfc-cons
[latest-26143]2026-05-31T15:23:44.547Z <default:INFO> Closing container Container#Predicate#rule-kwc6rmci/rule-kwc6rmci:S-1qanz01x-cons
[latest-26143]2026-05-31T15:23:44.547Z <default:INFO> Closing container Container#Predicate#rule-ladyja6a/24lq19p6-cons
[latest-26143]2026-05-31T15:23:44.547Z <default:INFO> Closing container Container#Predicate#rule-mk0o8iox/23oy468y-cons
[latest-26143]2026-05-31T15:23:44.547Z <default:INFO> Closing container Container#Predicate#rule-miscg2h3/rule-miscg2h3:S-22gmbq1c-cons
[latest-26143]2026-05-31T15:23:44.547Z <default:INFO> Closing container Container#Predicate#re-kxgrfjke/238p0old-cons
[latest-26143]2026-05-31T15:23:44.547Z <default:INFO> Closing container Container#Predicate#re-m7ccsso5/re-m7ccsso5-1r0myjxa-cons
[latest-26143]2026-05-31T15:23:44.547Z <default:INFO> Closing container Container#Predicate#rule-ladyja6a/19nl9wq2-cons
[latest-26143]2026-05-31T15:23:44.547Z <default:INFO> Closing container Container#Predicate#rule-ladyja6a/rule-ladyja6a:S-yl3xk9t-cons
[latest-26143]2026-05-31T15:23:44.547Z <default:INFO> Closing container Container#Predicate#rule-ladyja6a/rule-ladyja6a:S-yl3vv5m-cons
[latest-26143]2026-05-31T15:23:44.547Z <default:INFO> Closing container Container#Predicate#re-ln7j2nqp/re-ln7j2nqp-22mx9lzd-cons
[latest-26143]2026-05-31T15:23:44.547Z <default:INFO> Closing container Container#Predicate#re-ln7j2nqp/22mx87c8-cons
[latest-26143]2026-05-31T15:23:44.547Z <default:INFO> Closing container Container#Predicate#rule-licneppy/1mzwe7ht-cons
[latest-26143]2026-05-31T15:23:44.547Z <default:INFO> Closing container Container#Predicate#rule-ml3194ih/25jqt1j4-cons
[latest-26143]2026-05-31T15:23:44.547Z <default:INFO> Closing container Container#Predicate#re-kxgrg7kf/227hshak-cons
[latest-26143]2026-05-31T15:23:44.547Z <default:INFO> Closing container Container#Predicate#rule-reactorexmachina/13ua1p95-cons
[latest-26143]2026-05-31T15:23:44.547Z <default:INFO> Closing container Container#Predicate#rule-reactorexmachina/13uagam7-cons
[latest-26143]2026-05-31T15:23:44.547Z <default:INFO> Closing container Container#Predicate#rule-grpvl9oypg/rule-grpvl9oypg:R-134x4cbv-cons
[latest-26143]2026-05-31T15:23:44.547Z <default:INFO> Closing container Container#Predicate#rule-grpvl9oypg/rule-grpvl9oypg:R-134x2fyl-cons
[latest-26143]2026-05-31T15:23:44.547Z <default:INFO> Closing container Container#Predicate#re-lscjrws1/238p5c22-cons
[latest-26143]2026-05-31T15:23:44.547Z <default:INFO> Closing container Container#Predicate#rule-lbwr0jvq/1xkczf03-cons
[latest-26143]2026-05-31T15:23:44.547Z <Structure:NOTICE> Structure Structure#1 stopped
[latest-26143]2026-05-31T15:23:44.547Z <app:NOTICE> Closing APIs...
[latest-26143]2026-05-31T15:23:44.547Z <wsapi:NOTICE> wsapi: closing...
[latest-26143]2026-05-31T15:23:44.547Z <wsapi:NOTICE> wsapi: disconnecting from "192.168.1.23#82" (1001 service closing)
[latest-26143]2026-05-31T15:23:44.548Z <httpapi:NOTICE> HTTP API closing...
[latest-26143]2026-05-31T15:23:44.549Z <wsapi:NOTICE> wsapi: server closed
[latest-26143]2026-05-31T15:23:44.549Z <httpapi:INFO> HTTP server closed.
[latest-26143]2026-05-31T15:23:44.549Z <app:NOTICE> Stopping timers...
[latest-26143]2026-05-31T15:23:44.551Z <app:null> Shutdown complete, process ID 1
[latest-26143]2026-05-31T15:23:44.551Z <app:null> Closing logs...
[latest-26143]2026-05-31T15:23:44.551Z <default:null> Closing log
I can SSH to the VM. Alas, I do not have the previous image for 26143 as I'm a little too quick sometimes on housekeeping.
Today marks another milestone in my Home Automation journey.
After tripping the main breaker once, and shedding more blood than is normally recommended, the underfloor heating (which was the last Z-wave device on my system) has been replaced with a Zigbee one.
Edited reactor.conf
Disabled z-way-server
Disabled Openluup
Z-wave is no more....
C
Reputation
17
Profile views
40
Joined
Last Online