Skip to content
  • Categories
  • Recent
  • Tags
  • Popular
  • Unsolved
Collapse
Discussion Forum to share and further the development of home control and automation, independent of platforms.
A

Alan_F

@Alan_F
Disaster recovery and virtualisation
CatmanV2C

Following on from my last thread, some progress has been made over the weekend.

With 18G of spanky RAM in my Synology DS224+. I've jumped into the murky world of virtualisation and already eliminated the need for two Raspberry Pi's from my system.

Home Assistant: In theory they provide an OVA file which is supported by the Synology. I couldn't get it to work, however, so grabbed a copy of the .img file they supply, renamed it .iso and imported it as a VM. Restored from my full back up and that all seems fantastic.

Minidnla Music server: Trivial. Grabbed a Debian .iso for Bookworm and copied that onto the NAS. Created a new machine which mirrored the specs of the Raspberry Pi, booted from the ISO then did an expert install. Once that was all stable with a basic core of stuff and networking, I've made a copy of that as a good base system. Then fired up minidnla on it, mounted my media and that's also woking. Not bad for a short weekend's work.

Still not sure about the main NUC though. I'm thinking of buying a new USB stick so I can mess around getting it working on the Synology before I do anything drastic.

Once that hurdle is sorted I'm torn between:

Using a brand new install of Bookworm, re-installing Z-way server, OpenLuup, AltUI, MSR and HA bridge, then restoring across or Making an ISO of the current system, importing that and upgrading in place (which will be pretty risk free since I can snapshot everything before I make any changes.)

Decisions, decisions.

C

General Discussion
Remote access of Zwave stick from Z-wave server
CatmanV2C

Afternoon, all.

In my continued attempts to virtualise my system, I'm in the last (I hope throes)

I don't fancy relying on Synology not to break more USB activities, so decided to set up ser2net on a Raspberry pi and plug in a spare Z-wave.me stick

So on the Raspberry pi: ser2net. yaml

catman@Zwave:/etc $ cat ser2net.yaml %YAML 1.1 --- # This is a ser2net configuration file, tailored to be rather # simple. # # Find detailed documentation in ser2net.yaml(5) # A fully featured configuration file is in # /usr/share/doc/ser2net/examples/ser2net.yaml.gz # # If you find your configuration more useful than this very simple # one, please submit it as a bugreport define: &banner \r\nser2net port \p device \d [\B] (Debian GNU/Linux)\r\n\r\n connection: &zwave0 # Bind to TCP port accepter: tcp,4000 enable: on options: kickolduser: true # Ensure mDNS is disabled mdns: false connector: serialdev, /dev/ttyACM0,115200N81,nobreak,local

And if I telnet to it from anywhere:

catman@ChrisMBP15-2018 ~ % telnet 192.168.70.128 4000 Trying 192.168.70.128... Connected to 192.168.70.128. Escape character is '^]'.

Which makes me think that ser2net is doing its thing.

Now in my virtualised Z-wave server I have this:

Screenshot 2025-04-10 at 17.36.52.png

(I've tried with a colon and a space between the ip and the port)

The result:

An unexpected error occurred during loading data. Try to reload the page. Please check 1.) if the controller is plugged in correctly, 2.) that in the app 'Z-Wave Network Access' the right port is entered (UZB: '/dev/ttyACM0', RaZberry shield: '/dev/ttyAMA0', UZB-Windows: '\\.\COM3', Z-Stick: '/dev/ttyUSB0', embedded boxes: '/dev/ttyS0' or '/dev/ttyS1') 3.) the app is aktiv. If not you could activate it under Menu > Apps > Active or add a new one under Menu > Apps > Local. The Setting 'Expert View' needs to be active under Menu > My Settings.

Any pointers as to what I'm doing wrong?

TIA!

C

Software
Organizing/ structuring rule sets and rules
R

Hi guys,

Just wondering how you guys organize your rule sets and rules. I wish I had an extra layer to have some more granularity, but my feature request was not popular.

Maybe there are better ways to organize my rule sets.

I use the rule sets now primarily for rooms. So a rule set per room. But maybe grouping by functionality works better. Any examples/ suggestions would be appreciated.

Multi-System Reactor
Moving MSR from a QNAP container to RP 5 - some issues
Tom_DT

I have installed MSR on a RP5 bare metal and then copied the config and store files. Everything seems to be on the RP5 but I am missing all global expression and I don't see the controller time.

Screenshot 2025-04-06 201446.png

My browser is Microsoft Edge Version 135.0.3179.54 (Official build) (64-bit)

I have probably done something stupid or missed a step but I am stuck.

Thanks for any help.

Multi-System Reactor
Widget deletion does not work and landing page (status) is empy
M

Hi,
It seems that the widget deletion does not work. I tried to drag the widget to the left (as explained in here https://smarthome.community/topic/1071/deleting-widgets?_=1744037333660)
but it does not delete it. Anyone else experiencing the same problem?

Also the landing page after login is empty and seems be have some JS issues on the dev console:

Screenshot from 2025-04-07 18-06-19.png

fd7f0424-debb-49d3-86d8-9a3b09ad3868-image.png

Using dockerized version of Reactor (Multi-hub) latest-25082-3c348de6 on Chromium 135.0.7049.52 (Official Build) snap (64-bit)

br,
mgvra

Multi-System Reactor
Need help reducing false positive notifications
T

Good day all,
I have an notification set up for my washing machine to let me know when it's complete. I have a templete sensor set up in HAAS to let me know if it's Washing, in Standby, or off, based upon the power consumption (Shelly 1PM on outlets)

- name: "Washing Machine" state: > {% if states("sensor.washer_switch_0_power")|float == 0 %} Off {% elif states("sensor.washer_switch_0_power")|float <= 2.9 %} Standby {% else %} Washing {% endif %} icon: > {% if states("sensor.washer_switch_0_power") == "off" %} mdi:washing-machine-alert {% elif states("sensor.washer_switch_0_power")|float <= 2.9 %} mdi:washing-machine-off {% else %} mdi:washing-machine {% endif %} minutes: 2

The MSR code is relatively simple. I have a built in false positive attribute for if MSR gets rebooted, because I would suddenly get tons of notifications when I upgraded MSR.

6774565a-06cc-443f-99c1-e71301b33d83-image.png

What I'm trying to introduce, is a way to verify that I just didn't bump the knob on the washing machine when transferring loads from the washer to the dryer, which turns on the display and brings the power above the Standby threshold.

The power goes up to 3.7W for about 4 minutes if the selector knob is bumped/turned.

What would the best way to do this be? I have most of my MSR code set up for a couple of years now, and my coding logic is struggling a bit.

I think I need a power threshold to be substained for a minimum time period (say 2 or 3 minutes, above 10W), before the other triggers can act. What would the best way to do that be?

Running: latest-25082-3c348de6
Fedora 41 Server
HAAS:
Core
2025.3.4
Supervisor
2025.03.4
Operating System
15.1
Frontend
20250306.0

Multi-System Reactor
Reactor (Multi-System/Multi-Hub) Announcements
toggledbitsT

Build 21228 has been released. Docker images available from DockerHub as usual, and bare-metal packages here.

Home Assistant up to version 2021.8.6 supported; the online version of the manual will now state the current supported versions; Fix an error in OWMWeatherController that could cause it to stop updating; Unify the approach to entity filtering on all hub interface classes (controllers); this works for device entities only; it may be extended to other entities later; Improve error detail in messages for EzloController during auth phase; Add isRuleSet() and isRuleEnabled() functions to expressions extensions; Implement set action for lock and passage capabilities (makes them more easily scriptable in some cases); Fix a place in the UI where 24-hour time was not being displayed.
Multi-System Reactor
Deleting widgets
tunnusT

Hopefully a trivial question, but how do you delete widgets in a status page? Using build 22266

Multi-System Reactor
MQTT configuration question
tunnusT

I have the following yaml configuration in local_mqtt_devices file

x_mqtt_device: set_speed: arguments: speed: type: str topic: "command/%friendly_name%" payload: type: json expr: '{ "fan": parameters.speed }'

While this works fine, I'm wondering how this could be changed to "fixed" parameters, as in this case "fan" only accepts "A", "Q" or a numeric value of 1-5?

Multi-System Reactor
System Configuration Check - time is offset
F

Hi!

I get this message when I'm on the status tab:

System Configuration Check
The time on this system and on the Reactor host are significantly different. This may be due to incorrect system configuration on either or both. Please check the configuration of both systems. The host reports 2025-04-01T15:29:29.252Z; browser reports 2025-04-01T15:29:40.528Z; difference 11.276 seconds.

I have MSR installed as a docker on my Home Assistant Blue / Hardkernel ODROID-N2/N2+. MSR version is latest-25082-3c348de6.
HA versions are:
Core 2025.3.4
Supervisor 2025.03.4
Operating System 15.1

I have restarted HA as well as MSR multiple times. This message didn´t show two weeks ago. Don´t know if it have anything to do with the latest MSR version.
Do anyone know what I can try?
Thanks in advance!
Let's Be Careful Out There (Hill Street reference...) 🙂
/Fanan

Multi-System Reactor
Programmatically capture HTTP Request action status code or error
therealdbT

I have a very strange situation, where if InfluxDB restarts, other containers may fail when restarting at the same time (under not easy to understand circumstances), and InfluxDB remains unreachable (and these containers crashes). I need to reboot these containers in an exact order, after rebooting InfluxDB.

While I understand what's going on, I need a way to reliable determine that InfluxDB is not reachable and these containers are not reachable, in order to identify this situation and manually check what's going on - and, maybe, in the future, automatically restart them if needed.

So, I was looking at HTTP Request action, but I need to capture the HTTP response code, instead of the response (becase if ping is OK, InfluxDB will reply with a 204), and, potentially, a way to programmatically detect that it's failing to get the response.

While I could write a custom HTTP controller for this or a custom HTTP virtual device, I was wondering if this is somewhat on you roadmap @toggledbits

Thanks!

Multi-System Reactor
ZwaveJSUI - RGBWW BULB - Warm/Cold White interfered with RGB settings - Bulb doesn't change color if in WarmWhite state.
N

Hi ,
I'm on
-Reactor (Multi-hub) latest-25067-62e21a2d
-Docker on Synology NAS
-ZWaveJSUI 9.31.0.6c80945

Problem with ZwaveJSUI:
When I try to change color to a bulb RGBWW, it doesn't change to the RGB color and the bulb remains warm or cold white.
I tryed with Zipato RGBW Bulb V2 RGBWE2, Hank Bulb HKZW-RGB01, Aentec 6 A-ZWA002, so seems that it happens with all RGBWW bulb with reactor/zwavejsui.

I'm using from reator the entity action: "rgb_color.set" and "rgb_color.set_rgb".
After I send the reactor command, It changes in zwavejsui the rgb settings but doesn't put the white channel to "0", so the prevalent channel remains warm/cold White and the bulb doesn't change into the rgb color.

This is the status of the bulb in zwavejsui after "rgb_color.set" (235,33,33,) and the bulb is still warmWhite.

x_zwave_values.Color_Switch_currentColor={"warmWhite":204,"coldWhite":0,"red":235,"green":33,"blue":33}

The "cold white" and "warm white" settings interfer with the rgb color settings.

Reactor can change bulb colors with rgb_color set — (value, ui8, 0x000000 to 0xffffff) or rgb_color set_rgb — (red, green, blue, all ui1, 0 to 255) but if warm or cold white
are not to "0", zwavejsui doesn't change them and I can't find a way to change into rgb or from rgb back to warm white.

So if I use from reactor: rgb_color set_rgb — (235,33,33) in zwavejsui I have

x_zwave_values.Color_Switch_targetColor={"red":235,"green":33,"blue":33} 14/03/2025, 16:43:57 - value updated Arg 0: └─commandClassName: Color Switch └─commandClass: 51 └─property: targetColor └─endpoint: 0 └─newValue └──red: 235 └──green: 33 └──blue: 33 └─prevValue └──red: 235 └──green: 33 └──blue: 33 └─propertyName: targetColor 14/03/2025, 16:43:57 - value updated Arg 0: └─commandClassName: Color Switch └─commandClass: 51 └─property: currentColor └─endpoint: 0 └─newValue └──warmWhite: 204 └──coldWhite: 0 └──red: 235 └──green: 33 └──blue: 33 └─prevValue └──warmWhite: 204 └──coldWhite: 0 └──red: 235 └──green: 33 └──blue: 33 └─propertyName: currentColor

In zwavejsui, the bulb changes rgb set but warm White remains to "204" and the bulb remais on warm White channel bacause is prevalent on rgb set.

x_zwave_values.Color_Switch_currentColor_0=204 x_zwave_values.Color_Switch_currentColor_1=0 x_zwave_values.Color_Switch_currentColor_2=235 x_zwave_values.Color_Switch_currentColor_3=33 x_zwave_values.Color_Switch_currentColor_4=33

Is it possible to targetColor also for "warmWhite" and "coldWhite" and have something similar to this?

x_zwave_values.Color_Switch_targetColor={"warmWhite":0,"coldWhite":0,"red":235,"green":33,"blue":33}

Thanks in advance.

Multi-System Reactor
Problem with simultaneous notifications.
T

Good day all,
I have a reaction set up, that I use for both troubleshooting and changing home modes when one of my family members either arrive or are leaving. I use the companion app for HAAS on our iPhones, and HAAS reports if the person associated with the iPhone enters or leaves the geofenced area around my home. I'm sure most MSR and HAAS users are familiar with this.

I use this rule set mainly as a condition for other rules, however, as part of troubleshooting, a notification is sent through HAAS to the companion app when the rule becomes true. The problem is that I'm getting notifications now for both arriving and departing simultaneously.

96b3f7db-ba09-499e-a78c-86903b603857-image.png

36903cdd-a87f-473b-82ef-af9ef96d3c44-image.png It used to work fine as intended. I'm not sure exactly when it changed, but now I'm getting two notifications when either of these conditions change.

Any idea what could be happening?

Edit:
Running: latest-25082-3c348de6, bare-metal Linux
ZWaveJSControllerr [0.1.25082]

Multi-System Reactor
Problem after upgrading to 25067
R

MSR had been running fine, but I decided to follow the message to upgrade to 25067. Since the upgrade, I have received the message "Controller "<name>" (HubitatController hubitat2) could not be loaded at startup. Its ID is not unique." MSR throws the message on every restart. Has anyone else encountered this problem?
I am running MSR on a Raspberry Pi4 connecting to two Hubitat units over an OpenVPN tunnel. One C8 and a C8 Pro. Both are up-to-date. It appears that despite the error message that MSR may be operating properly.

Multi-System Reactor
Global expressions not always evaluated
tunnusT

Similarly as for local expressions, global expressions evaluate and update fine when getEntity(...) structure is used. However, at least when certain functions are in use, expressions do not update.

Consider the following test case:

Screenshot 2025-03-13 at 16.29.42.png

Even though auto-evaluation is active, value does not change (it changes only if that expression is manually run). MSR restarts do not help.

Screenshot 2025-03-13 at 16.31.43.png

Note: Tested using build 25067 on Docker. I have also a PR open (but couldn't now get details or PR number as my Mantis account was somehow expired?).

Multi-System Reactor
[Solved] Local expression evaluation
V

Trying to understand what cause a local expresssion to be evaluated. I have read the manual but I am still not clear about it. Using the test rule below, I can see in the log that the rule is being automatically evaluated every time the temperature entity is changing. That is great...

What I am trying to understand is why the expression is not evaluated based on time as well since the "case" statement has time dependencies.

Any help would be appreciated

I have the following test rule:

eba6a3ea-ff61-4610-88c9-9b9864f11ff8-Screenshot 2025-01-21 095244.png

2d9c1ff5-7b73-4005-b324-9029c2709db9-Screenshot 2025-01-21 095302.png

Here is the expressioncode:

vFrom1 = "09:25:00", vFrom2 = "09:30:00", vFrom3 = "09:41:00", vTo = "10:55:00", # Get current time (format HH:MM:SS) vToDay = strftime("%H:%M:%S"), #Get current house temperature CurrentHouseTemp = getEntity( "hass>Thermostat2 " ).attributes.temperature_sensor.value, case when CurrentHouseTemp <= 19 and vToDay >= vFrom1 && vToDay <= vTo: "true1" # From1 when CurrentHouseTemp <= 20 and vToDay >= vFrom2 && vToDay <= vTo: "true2" # From2 when CurrentHouseTemp < 26  and vToDay >= vFrom3 && vToDay <= vTo: "true3" # From3 else "false" end
Multi-System Reactor
[Solved] Runtime error when exiting global reaction that contains a group
S

I am getting a Runtime error on different browsers when I click exit when editing an existing or creating a new global reaction containing a group. If the global reaction does not have a group I don't get an error. I see a similar post on the forum about a Runtime Error when creating reactions but started a new thread as that appears to be solved.

The Runtime Error is different in the two browsers
Safari v18.3

@http://192.168.10.21:8111/reactor/en-US/lib/js/reaction-list.js:171:44 You may report this error, but do not screen shot it. Copy-paste the complete text. Remember to include a description of the operation you were performing in as much detail as possible. Report using the Reactor Bug Tracker (in your left navigation) or at the SmartHome Community.

Google Chrome 133.0.6943.142

TypeError: self.editor.isModified is not a function at HTMLButtonElement.<anonymous> (http://192.168.10.21:8111/reactor/en-US/lib/js/reaction-list.js:171:34) You may report this error, but do not screen shot it. Copy-paste the complete text. Remember to include a description of the operation you were performing in as much detail as possible. Report using the Reactor Bug Tracker (in your left navigation) or at the SmartHome Community.

Steps to reproduce:
Click the pencil to edit a global reaction with a group.
Click the Exit button.
Runtime error appears.
or
Click Create Reaction
Click Add Action
Select Group
Add Condition such as Entity Attribute.
Add an Action.
Click Save
Click Exit
Runtime error appears.

I don’t know how long the error has been there as I haven’t edited the global reaction in a long time.

Reactor (Multi-hub) latest-25060-f32eaa46
Docker
Mac OS: 15.3.1
Thanks

Multi-System Reactor
Cannot delete Global Expressions
SnowmanS

I am trying to delete a global expression (gLightDelay) but for some strange reason, it comes back despite clicking the Delete this expression and Save Changes buttons.

I have not created a global expression for some times and just noticed this while doing some clean-up.

I have upgraded Reactor to 25067 from 25060 and the behaviour is still there. I have restarted Reactor (as well as restarting its container) and cleared the browser's cache several times without success.

Here's what the log shows.

[latest-25067]2025-03-08T23:50:22.690Z <wsapi:INFO> [WSAPI]wsapi#1 rpc_echo [Object]{ "comment": "UI activity" } [latest-25067]2025-03-08T23:50:26.254Z <GlobalExpression:NOTICE> Deleting global expression gLightDelay [latest-25067]2025-03-08T23:50:27.887Z <wsapi:INFO> [WSAPI]wsapi#1 rpc_echo [Object]{ "comment": "UI activity" }

Reactor latest-25067-62e21a2d
Docker on Synology NAS

Multi-System Reactor
Advice on Storing and Backing Up Bind Mounts - Docker
PablaP

Hello all, after seeing Catman's posts about their disaster recovery and move to Docker I took that as a sign to migrate everything (aside from HA) to Docker. After a small learning curve I had Docker+Portainer up and running in a few days.

Instead of using named Volumes I opted to use Bind Mounts so I can easily edit conf files and any other file needed. I do understand the nuances that come with bind mounts, such as migration to a different host may require changing file structures, the possibility of someone editing the bind mount files and permissions but to me those aren't too big of a deal.

My question is what is the best way to keep a back up of these bind mounts? I currently have them stored in the /etc directory in another directory named on a per container basis. I was thinking to move it all to a /home/user/docker/ directory so that I can use a simple cp command to my mounted SMB share to backup all the container data files. Anyone else do it differently?

Side note: I finally got to flex the benefits of Docker with updating Reactor.. it was dead simple. I had no idea what I was missing out on lol!

Software
Local notification methods?
CatmanV2C

Morning, experts. Hard on learning about the internet check script in MSR tools, I was wondering what suggestions anyone has about a local (i.e. non-internet dependent) notification method.

This was prompted by yesterday's fun and games with my ISP.

I've got the script Cronned and working properly but short of flashing a light on and off, I'm struggling to think of a way of alerting me (ideally to my phone)

I guess I could set up a Discord server at home, but that feels like overkill for a rare occasion. Any other suggestions?

TIA

C

Multi-System Reactor
About
Posts
76
Topics
13
Groups
0
Followers
0
Following
0

Posts

Recent Best Controversial

  • [SOLVED] Hubitat / log data from new hub information device after deleting original?
    A Alan_F

    @toggledbits Is that in the reactor.yaml file? I don't have the old one configured there. It just automatically worked. Influx section of my reactor.yaml is below with most of the commented lines removed.

    plugins:
      - id: influx
        # See the docs under Standard Plugins for configuration details.
        implementation: InfluxFeed
        enabled: true
        name: InfluxDB Feed
        config:
          # influx_url - URL to access InfluxDB server (default: http://localhost:8086)
          influx_url: http://192.168.0.X:8085
          
          # influx_org - Organization ID (required)
          influx_org: "org1"
          #
          # influx_bucket - Bucket name to which points are written (required)
          influx_bucket: "msrdata"
          #
          # ----- For InfluxDB 1.8+ ONLY -----
          # influx_database - Database name for data storage (required)
          influx_database: "reactor"
          #
          # influx_username - Username for database access (required)
          influx_username: "reactor"
          #
          # influx_password - Password for database access (required)
          influx_password: "mypassword"
          
          select_capabilities:   
            light_sensor: true   
            temperature_sensor:
              attributes:
                value:
                  type:number
                units:
                  type: string
            x_hubitat_extra_attributes:
              attributes:
                cpu5Min:
                  type: number
                cpuPct: 
                  type: number
                freeMemory:
                  type: number
                dbSize:
                  type: number
            wx:
              attributes:
                - temperature
                - humidity
                - cloud_cover
    

    So I think it should be picking it up from the 'x_hubitat_extra_attributes'. The new hub information device also has those attributes when I examine it in Entities.

    Edit: Found it --- the Grafana chart was filtered on 'WHERE name = Hub Information'
    when i removed that, the data (which was never really missing) appeared on the chart.

    Before:
    980e4294-521a-4763-895c-325cfa47ff32-image.png

    After:
    38ac14c6-f988-4aa4-922d-e023c5411601-image.png

    and digging a little further: I changed the capitalization on the device name when I recreated it:
    ded0a9f9-5683-4724-9b51-a28453c3b8e5-image.png


  • [SOLVED] Hubitat / log data from new hub information device after deleting original?
    A Alan_F

    MSR latest-22310, Raspberry Pi 4 / Docker

    While troubleshooting another issue, I deleted and recreated the hub information device on one of my Hubitat hubs. Reactor had been logging the old device information to InfluxDB, but it doesn't appear to have detected the new device. I made sure to enable the new device in Maker API, I've restarted reactor and done a 'docker-compose down' / 'docker-compose up - d'. Still no new data going to influxdb.

    My recollection is that the Hubitat hub device is baken into MSR and is auto-detected, and that it isn't manually configured anywhere. I checked the docs and searched the forum without success.

    Any advice on how I can get MSR to start logging the info from the new device?


  • Quality of Life Request: Update Button
    A Alan_F

    I don't know if this helps for other Docker users, but not long after I got started with Docker I found Portainer, and I've been running it alongside Reactor and my other containers on my Raspberry Pi 4. With Portainer, there may not be a one-step update button, but I find it makes updates much easier.

    I just updated Reactor to the latest. All I had to do was go to the Portainer URL in my browser, then

    • Click on the Reactor container in the Containers list

    60d60151-1169-4eea-be84-616771dd9928-image.png

    • Click 'Recreate"

    • Toggle "Always pull new image" on the window that pops up

    cd2ddb33-ac06-4da4-97d7-f3cd5389ac2f-image.png

    • Click "Recreate"

    It isn't one click, but it can be done in a browser tab from any machine with network access to the Docker host. No VNC/SSH into the machine, no Docker commands to run from the command line.

    Portainer also has links to view the container logs and to open a command window in the container, which I use all the time. You can also use the "duplicate/edit" button to change or add environment variables while updating, which is how I added the NODE_PATH a few updates back.


  • Can the list of rule sets be sorted?
    A Alan_F

    So it works just like most of the other elements in MSR.

    Move along people... nothing to see here... just me missing the obvious.


  • Can the list of rule sets be sorted?
    A Alan_F

    Maybe a dumb question if I'm missing something obvious, but I checked the manual and searched the forum without finding anything relevant...

    Can the Rule Sets on the left side of the MSR web UI be re-sorted? I just realized that it seems to be sorted with the newest ones at the top and I would prefer to have them alphabetical... and to have a multi-level tree with nested rulesets... but I'll settle for alphabetical for now if there's a way to do it 🙂

    MSR latest-22266 / Raspberry Pi 4 / Docker


  • InfluxDB - is it possible to log expressions as well as entities?
    A Alan_F

    Excellent. I'll read up on that and figure out whether the node-red or VirtualEntityController route is cleaner.

    Thanks!


  • InfluxDB - is it possible to log expressions as well as entities?
    A Alan_F

    Checking in on this, because I'm still struggling with getting this data logged. My other option is to set up a logger in NodeRed where I already have all the data coming over by MQTT, and I would have to set up the database connection and queries to push the data over from there. How far down on the wish list is this? If it's not anywhere near the top, I will probably try the NodeRed route.


  • [SOLVED] "Action must be edited to update to the latest stored form"
    A Alan_F

    @toggledbits I've tried editing the headers field to add and then remove a space, and I tried deleting the headers entirely. That caused them to default to "Content-Type: application/x-www-form-urlencoded". I saved that and then changed it back to the application/json header. Still getting the error.


  • [SOLVED] "Action must be edited to update to the latest stored form"
    A Alan_F

    TLDR: I'm getting an alert saying I have to edit and re-save a rule containing a HTTP POST request in order to update it, but following the instructions in the alert doesn't seem to fix the issue.

    I am receiving this message in the Current Alerts when sending a HTTP POST request.

    The action at step 1 of "Send Notification Reaction" (re-I7yq7e15) needs to be edited to update it to the latest stored form. The action will continue, but should be updated as soon as possible, before this form is deprecated and no longer functions. Just make a trivial edit to the "headers" argument and then save the reaction to update it.

    Details:

    I am using a self-hosted notification system - Gotify. Many of my rules use a HTTP POST action to send a notification through this system. The message contains a JSON body with the title, body, and message priority. It is posted to a URL on my LAN where the Gotify server resides.

    When I updated to latest-22252-65e94b36 I started to receive the above error. Since I had the http request in many rules I took the opportunity to simplify things by moving the http request to a Reaction in the Reactions section of MSR. I created two variables to pass the notification content to the Reaction and now send all notifications via the one Reaction. Each rule that needs to send a reaction sets the variable values and then runs the Reaction.

    For example, this rule runs if the Kitchen Main leak sensor detects a leak. It sets the variable "g_gotify_token" to a value (this is used as part of the URL when making the HTTP request) and sets "g_gotify"body" to a JSON formatted string. In this case that string is

    { "title":"Water Alert", "message": "Kitchen Main Leak Sensor Tripped", "priority": 8 }
    

    Finally, the rule runs the Reaction "Send Notification Reaction"

    79fd4034-c611-4173-b4e4-18cf5091b453-image.png

    That reaction contains the http request. It uses the variables in the URL and request body fields. The request headers field is static and is set to "Content-Type: application/json"

    d75d9305-a5ab-4401-9b75-ea72d08787fa-image.png

    I get the same error when I directly call the HTTP request from a rule without using any variables. Either way, the notification goes through successfully. The only issue is the alert being raised in MSR.

    I tried editing and re-saving the Reaction, and also tried creating an entirely new reaction. I get the same warning message either way.

    footnote: Because I use the same process to send a notification whenever there is an alert raised in MSR, this also created a loop (that thankfully got throttled pretty quickly) where the system was making the http request to send a notification that this alert had been raised, and the action of sending that notification raised the alert again... etc...

    Is this just a bug? Am I missing something about the request format that needs to be updated? I checked the manual and this forum for answers, but didn't find anything that looked relevant.


  • [SOLVED] 'not in' being ignored latest-22240-3b3254d6
    A Alan_F

    @gwp1 I was away from the forum for a few days, but to answer your question, I use the Hubitat app for Android on my phone and my wife's phone to determine presence. Every once in a while they break it with an update and I can use the Google assistant presence instead. I prefer Hubitat because you can set a geofence and I have them set up not to consider us away when walking the dogs in the neighborhood, but to have us away when we're at my parent's house just outside our usual walking route. Google doesn't give me that level of control over what's considered home or away.


  • [SOLVED] 'not in' being ignored latest-22240-3b3254d6
    A Alan_F

    Just a curious onlooker here... why aren't you just letting the Hubitat set these statuses? Is it just a desire to keep all the logic in Reactor? I have Hubitat Mode Manager configured to set Day at sunrise and Night at sunset +30 except when the mode is Away. It sets Away when all users leave, sets Day when any user returns between sunrise and sunset +30, and it sets Night when any user returns between sunset +30 and sunrise. I'm using the Hubitat app for presence sensing, and it looks like you're using HASS, so maybe that makes keeping the log in Reactor a better way to go.

    I have rules in Reactor that depend on the status (like switching modes in Blue Iris or changing modes on IP cameras), but the basic status determination comes from my Hubitat and it works flawlessly. Now that I said that, it's going to fail tonight 🙂


  • Cheapest platform on which to run MSR
    A Alan_F

    @black-cat I run Reactor and Portainer on a Pi4 without any issues.

    The Pi is running Node-Red (bare metal), and in Docker: Teslamate (includes Teslamate, Grafana, Traefik, PostgreSQL, MQTT), Reactor (includes InfluxDB for Reactor, Chronograf, Telegraf), Gotify (a self-hosted notification platform), and a Tesla Powerwall integration (includes 2nd instances of Telegraf and InfluxDB, Grafana, and pypowerwall). Fifteen containers when you add Portainer itself. The Portainer GUI makes this all much easier to manage.


  • Notifications from Alerts
    A Alan_F

    @rogero See this thread: https://smarthome.community/topic/706/notifications-from-alerts/3


  • MSR/MQTT - detecting broker offline status
    A Alan_F

    I'm running latest-22080-ae7212f under Docker on a Raspberry Pi 4. MQTT is running in a docker on the same Pi.

    I have a rule that should notify me if my MQTT broker is offline and make an http call to Node-Red to attempt to restart the MQTT container.

    If MQTT is offline and I restart Reactor, I can see in the logs that it tries to connect to MQTT for a few seconds before it appears to time out. When Reactor finishes its restart I get the notification.

    However I just tested it by taking the MQTT broker down while Reactor was already up and running, and after about 5 minutes it hadn't detected the MQTT system status as down. How long should it take for Reactor to notice that the MQTT system is down outside of a Reactor restart? Or will it not detect the broker offline except at the initial connection attempt?


  • [Solved] Arm for Eastern Standard Time/Daylight Saving Time
    A Alan_F

    @gwp1 I'm not actually doing this, that was just my thoughts on how it could be done (= untested speculation 😁). I think it would have to be two rules. That way each rule is firing at one specific date and time and you wouldn't be trying to create a rule that is active at all dates and times between DST start and DST end, which I think leads you down the OP's path using latching. If you have one rule with a reset action there's no need for the expression, you could just use the rule state to tell if it's DST.


  • [Solved] Arm for Eastern Standard Time/Daylight Saving Time
    A Alan_F

    I tried to follow your example but I'm confused. Shouldn't the "and the rest" rule start on April 1st instead of March 1st? I'm definitely not a latching expert, so maybe I'm the wrong person to try to understand what you've done.

    Not being competent with latching, the approach I would probably take would be to create an expression 'is_dst' and have a rule that sets it to true on the second Sunday of March at 0300 and sets it to false on the first Sunday in November at 01:59:59. Initially set it to the correct value and then just refer to the expression whenever a rule needs to know if DST is in effect. Seems simpler to me and I think it would work just as well.

    My state legislature is considering a bill to stay on DST permanently. It would require federal approval, so it's probably not going to happen anytime soon, but there's another way to solve the problem. 😁


  • [Solved] Reactor 22067 + Hubitat / InfluxDB feed storing wrong value then stopping on specific attributes
    A Alan_F

    Just realized I was only looking in the Hubitat.log file, which we turned on while trying to troubleshoot something else, and not in the reactor.log file... Ugh... need more coffee before trying to troubleshoot. Apologies for making this more difficult by missing that. In the reactor.log files I found the Influx errors saying that the database field was type 'float' and the data from the hub was 'string'. If I had posted that at the top of this thread, it would be a much shorter read.

    After changing the attributes as you showed above I'm now getting correct data into the database and I'm not seeing errors in reactor.log.


  • [Solved] Reactor 22067 + Hubitat / InfluxDB feed storing wrong value then stopping on specific attributes
    A Alan_F

    @toggledbits I wasn't expecting a reply until you got back from vacation and handled other higher priority things, but I'll try to add the additional information now:

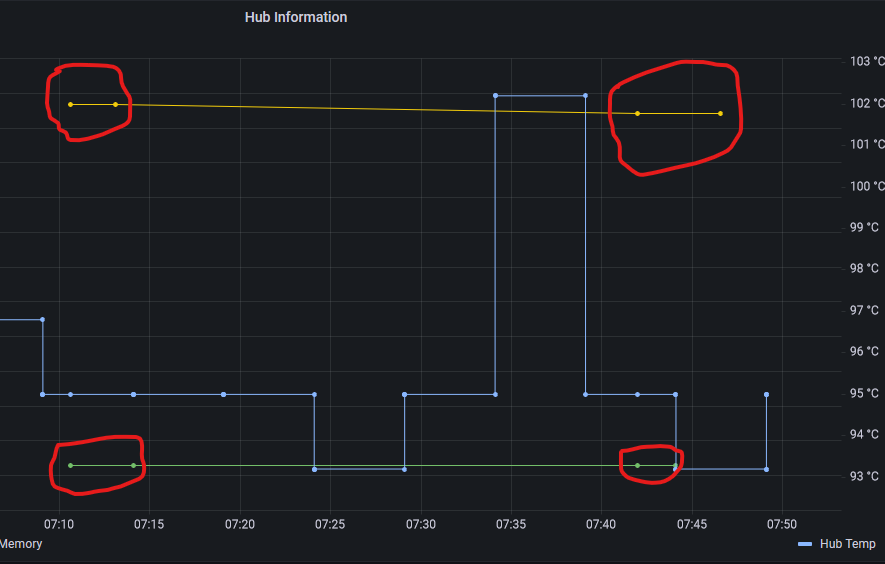
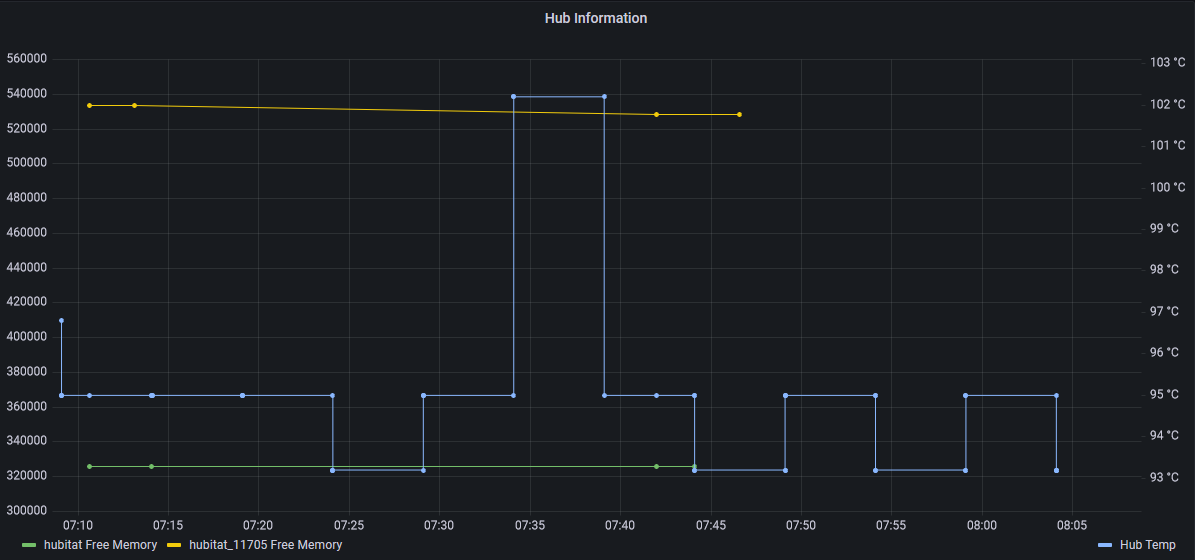
    What I'm expecting is that each time the data on the Hubitat Hub Information device changes, that the values for that I added in my reactor.yaml file (cpu5Min, cpuPct, freeMemory) will be written to the influx database. This is what it was doing up until two days ago, and I think the change in behavior matches up to when I upgraded to 22067.

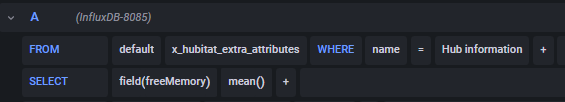
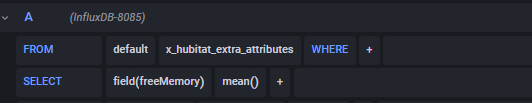
    The Grafana queries are not using aggregates, nor was the direct query I ran from Influx via the command line, but I should have posted the query I used to pull the data. Here is data I just pulled directly from Influx using a command prompt, filtering on only one hub to make it simpler:

    > select * from x_hubitat_extra_attributes where entity = 'hubitat>483' order by time desc limit 6
    name: x_hubitat_extra_attributes
    time                controller cpu5Min cpuPct entity      freeMemory name
    ----                ---------- ------- ------ ------      ---------- ----
    1646918045910000000 hubitat    0.23    5.75   hubitat>483 324088     Hub information
    1646918032714000000 hubitat    0.23    5.75   hubitat>483 324088     Hub information
    1646916245576000000 hubitat            3      hubitat>483 325848     Hub information
    1646916119494000000 hubitat            3      hubitat>483 325848     Hub information
    1646914445106000000 hubitat    0.11    2.75   hubitat>483 325904     Hub information
    1646914238104000000 hubitat    0.11    2.75   hubitat>483 325904     Hub information
    

    Starting from the bottom of the list with the oldest two records, they are about 4 minutes apart but show the exact same numbers.

    The next two records again are about 4 minutes apart and show the same numbers.

    The top two records are about 1 minute apart and show the same numbers.

    Between each pair of logged values I restarted Reactor. On the last set - the top two in this list - I was watching the Reactor Entities screen and saw that the Hub Information entity updated at the time the last data point was stored, but the values were NOT 0.23, 5.75, and 324088.

    I can upload logs when you get back. I looked at the times in the log when this data was stored and I don't see anything related to Influx. I do see the updates coming from the Hub Information device.

    I was able to find the logs corresponding to the two records in the middle (showing 325848 as the freeMemory)

    The timestamp on the older one converts to: Thursday, March 10, 2022 12:41:59.494 PM

    In the logs I find the value for the freeMemory a few minutes earlier at 12:39:05Z. I think the time discrepancy is because I restarted Reactor between when the value was logged and when it got written to the database. When Reactor started up, it wrote the most recent value to Influx.

    [latest-22067]2022-03-10T12:39:05.568Z <HubitatController#hubitat:5:HubitatController.js:641> HubitatController#hubitat received DEVICE event [Object]{ "source": "DEVICE", "name": "freeMemory", "displayName": "Hub information", "value": "325848", "type": "null", "unit": "KB", "deviceId": 483, "hubId": 0, "installedAppId": 0, "descriptionText": "null" }
    [latest-22067]2022-03-10T12:39:05.569Z <HubitatController#hubitat:INFO> HubitatController#hubitat fast update Entity#hubitat>483 event freeMemory="325848"
    [latest-22067]2022-03-10T12:39:05.569Z <HubitatController#hubitat:INFO> HubitatController#hubitat fast update Entity#hubitat>483 event freeMemory="325848"


    The next record from the database with the same values has a timestamp that converts to Thursday, March 10, 2022 12:44:05.576 PM

    That matches up in the logs with this:

    [latest-22067]2022-03-10T12:44:05.632Z <HubitatController#hubitat:5:HubitatController.js:641> HubitatController#hubitat received DEVICE event [Object]{ "source": "DEVICE", "name": "freeMemory", "displayName": "Hub information", "value": "325884", "type": "null", "unit": "KB", "deviceId": 483, "hubId": 0, "installedAppId": 0, "descriptionText": "null" }
    [latest-22067]2022-03-10T12:44:05.633Z <HubitatController#hubitat:5:HubitatController.js:643> HubitatController#hubitat ws DEVICE event device 483 freeMemory="325884"
    [latest-22067]2022-03-10T12:44:05.633Z <HubitatController#hubitat:INFO> HubitatController#hubitat fast update Entity#hubitat>483 event freeMemory="325884"
    

    So at 12:44:05 I'm expecting the freeMemory written to the database to be 325884, but the database query returned 325848, the previous value from a few minutes earlier in the logs.

    The next instance of the hub freeMemory in the logs is at 12:49:05Z

    [latest-22067]2022-03-10T12:49:05.763Z <HubitatController#hubitat:5:HubitatController.js:641> HubitatController#hubitat received DEVICE event [Object]{ "source": "DEVICE", "name": "freeMemory", "displayName": "Hub information", "value": "325664", "type": "null", "unit": "KB", "deviceId": 483, "hubId": 0, "installedAppId": 0, "descriptionText": "null" }
    [latest-22067]2022-03-10T12:49:05.764Z <HubitatController#hubitat:5:HubitatController.js:643> HubitatController#hubitat ws DEVICE event device 483 freeMemory="325664"
    [latest-22067]2022-03-10T12:49:05.765Z <HubitatController#hubitat:INFO> HubitatController#hubitat fast update Entity#hubitat>483 event freeMemory="325664"
    

    There is no corresponding record in the Influx database. I would expect an entry with freeMemory of 325664.

    There are additional logs showing the Hubitat Hub Information device updating values every few minutes, but nothing was added to the database until after 1:13:52Z when I restarted Reactor. Then I got the two entries showing a freeMemory of 324088, but as with the middle two record in the query results, the second one of the pair is wrong. The last (top of the list) data in the database shows freeMemory of 324088 and its timestamp converts to Thursday, March 10, 2022 1:14:05.910 PM

    The log shows:

    [latest-22067]2022-03-10T13:14:05.943Z <HubitatController#hubitat:5:HubitatController.js:641> HubitatController#hubitat received DEVICE event [Object]{ "source": "DEVICE", "name": "freeMemory", "displayName": "Hub information", "value": "323712", "type": "null", "unit": "KB", "deviceId": 483, "hubId": 0, "installedAppId": 0, "descriptionText": "null" }
    [latest-22067]2022-03-10T13:14:05.945Z <HubitatController#hubitat:5:HubitatController.js:643> HubitatController#hubitat ws DEVICE event device 483 freeMemory="323712"
    [latest-22067]2022-03-10T13:14:05.945Z <HubitatController#hubitat:INFO> HubitatController#hubitat fast update Entity#hubitat>483 event freeMemory="323712"
    

    I would have expected the database entry at 13:14:05Z to show 323712 as the freeMemory value.

    I haven't restarted Reactor since then, and as I type this several hours later, no new data for these attributes has made it into the database.


  • [Solved] Reactor 22067 + Hubitat / InfluxDB feed storing wrong value then stopping on specific attributes
    A Alan_F

    Reactor latest-22067 on Raspberry Pi, Influx DB 1.8, both in Docker. Controlling two separate Hubitat C7s.

    I am storing data for CPU load and free memory from the Hub Information device on the Hubitat Hub in the Influx database so that I can graph them.

    I noticed that for the last two days I was not getting the free memory on my graph. (I don't currently graph the CPU data.) When I restarted Reactor I got two data points and then nothing for a while.

    I looked at the Hubitat Hub Information device and could see the numbers changing there. I also watched the entities screen in Reactor and could see it flash green when it updated. Both the Hubitat device and the Reactor entities matched and were updating.

    However the Influx database stopped getting new data. What I see in Grafana matches what I see when I directly query the database in a terminal window, so it is not an issue with Grafana.

    The Hub Temperature data is updating in the database every time it changes. It is not one of the extra attributes that I added. It is logged as a regular temperature_sensor.

    This is the relevant portion of reactor.yaml:

          select_capabilities:   
            light_sensor: true   
            x_hubitat_Thermostat:
              attributes:
                - coolingSetpoint
                - heatingSetpoint
                - thermostatFanMode
                - thermostatMode
                - thermostatOperatingState
                - thermostatSetpoint
                - temperature
            x_hubitat_extra_attributes:
              attributes:
                - cpu5Min
                - cpuPct
                - freeMemory
            wx:
              attributes:
                - temperature
                - humidity
                - cloud_cover
    

    This chart from Grafana illustrates what is happening. The data points circled in red are the pairs of points from two restarts of Reactor. The yellow line and green line represent the two separate Hubitat hubs that I'm connected to. The blue line is the CPU temperature from one of the hubs.

    ac19c0aa-d9f5-4b82-9f8d-05d6ea2acc9e-image.png

    Here is the same graph from a little later to show the CPU temp is continuing to update, but the free memory is not:

    4014600c-8501-4e58-b13c-987b5a6e9502-image.png

    Again, the free memory is changing in the entities screen every time it changes in the hub, but the data isn't being saved to InfluxDB after the first two data points.

    Looking at the most recent documentation, I saw the format for the attributes was different, using a trailing ":true" intead of a leading "-", so I tried switching my reactor.yaml to match. The section now reads:

        x_hubitat_extra_attributes:
          attributes:
            cpu5Min: true
            cpuPct: true
            freeMemory: true
    

    I restarted Reactor and got the same result.

    Final observation... the second data point in each pair is incorrect...

    After the last restart I pulled the data from the database.

    time                controller    cpu5Min cpuPct entity            freeMemory name
    ----                ----------    ------- ------ ------            ---------- ----
    1646918194198000000 hubitat_11705 0.07    1.75   hubitat_11705>130 526192     Hub information
    1646918045910000000 hubitat       0.23    5.75   hubitat>483       324088     Hub information
    1646918032985000000 hubitat_11705 0.07    1.75   hubitat_11705>130 526192     Hub information
    

    The first and third lines are relevant here. They are both for the 'hubitat_11705' hub. They show the free memory as 526192 on both lines.

    But when the second data point was saved to the database the reactor entity showed:

    x_hubitat_extra_attributes.freeMemory="525728"
    

    and the Hubitat device shows:

    60812ba1-6200-4e3e-8ee5-2ebb0346d487-image.png

    So the second data point should have been saved in the database as '525728' but instead it saved the previous value of 526192.

    Looking back at the annotated Grafana graph I can see the same thing happened with the earlier pairs of points... the second point was the same value as the first, and then there was no more data logged until the next Reactor restart.


  • [SOLVED] Expressions not auto-updating when dependencies change (22022)
    A Alan_F

    Option 2 seems like the way to go. I'll make that change and wait for nothing to happen ☺

  • Login

  • Don't have an account? Register

  • Login or register to search.
  • First post
    Last post
0
  • Categories
  • Recent
  • Tags
  • Popular
  • Unsolved