
MSR controller status panel
-
Running latest version of MSR in Docker on Bullseye/Raspberry Pi CM4. Every time I "restart" MSR it returns to the default set of status panels. I add "Controller Status", but it disappears on every restart. Is this the planned behavior or do I have an issue somewhere?
-
For quite a while now, the status panel configuration is not stored on the server side at all — the status panel config knows nothing of restarts of the server, and the server knows nothing about status panel configuration. Status panel configuration is entirely stored in the browser using its local storage facility, and the code to manage it runs entirely on the browser and does not use any server-based facilities.
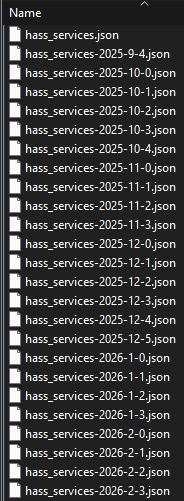
However, in an older version (going wayyy back), it was stored on the server, and it may be that Reactor is unable to remove the old configuration file, so it keeps using/reverting back to it. Stop Reactor, go into your
storage/statesdirectory, and remove thestatus_layout.jsonfile if you find one. Then restart Reactor and hard refresh all browsers.If you don't have a
status_layout.jsonfile, then it's purely a browser issue.If you are using a browser with ad-blockers or other privacy-enhancing features or add-ons, these could be blocking the attempt by the application to set local storage. In that case, there is usually a way to "whitelist" (disable the blocking features) for an IP or domain, and you should use that with the IP of the Reactor host.
After every update of Reactor, you should be doing a hard refresh of browsers that you use with Reactor, particularly if you see any odd UI behaviors like this. This ensures that you are loading the latest versions of the UI code and that the UI data is in complete sync with the server/API.
You also might open the develop tools in the browser after making a status panel configuration change, specifically the console window, and reporting any error messages related to
localStorageor similar that you may see there. On most browsers you can do this by hitting F12. There also may be a "Developer Tools" item on the browser's menu (sometimes buried under a "More Tools" item). The Console window or tab will contain messages (not just errors, so you have to sift) emitted by the browser and all running scripts in the tab.You might try a different browser as well, to see if the results are more in line with expectation.
If you have any further correspondence on this, I need to know what browser you are using, including its version, and your client/browser platform (Mac, PC, etc.).
-
Hard refresh solved the issue. Thanks.
-
 T toggledbits locked this topic on