@toggledbits I understand that you do not perform testing on Mac computers but thought I'd share the following with you in case something can be done.
I started seeing these errors with version 24302. I thought that upgrading to 24343 would have fixed the issue but unfortunately not. I either have to close the browser or clear the cache for the errors to stop popping-up but they slowly come back.
I see these errors on the following browsers:
Safari 16.6.1 on macOS Big Sur Safari 18.1.1 on MacOS Sonoma DuckDuckGo 1.118.0 on macOS Big Sur and Sonoma Firefox 133.0.3 on macOS Big Sur Chrome 131.0.6778 on macOS Big SurHere are the errors
Safari while creating/updating an expression
@http://192.168.0.13:8111/reactor/en-ca/lib/js/reaction-editor.js:543:91 makeExprMenu@http://192.168.0.13:8111/reactor/en-ca/lib/js/reaction-editor.js:537:28 @http://192.168.0.13:8111/reactor/en-ca/lib/js/reaction-editor.js:92:64 @http://192.168.0.13:8111/reactor/en-ca/lib/js/reaction-editor.js:89:68 each@http://192.168.0.13:8111/node_modules/jquery/dist/jquery.min.js:2:3133 @http://192.168.0.13:8111/reactor/en-ca/lib/js/reaction-editor.js:89:35 @http://192.168.0.13:8111/client/MessageBus.js:98:44 forEach@[native code] @http://192.168.0.13:8111/client/MessageBus.js:95:54 @http://192.168.0.13:8111/client/MessageBus.js:106:44 @http://192.168.0.13:8111/client/Observable.js:78:28 signalModified@http://192.168.0.13:8111/reactor/en-ca/lib/js/ee.js:146:21 signalModified@http://192.168.0.13:8111/reactor/en-ca/lib/js/expression-editor.js:40:29 reindexExpressions@http://192.168.0.13:8111/reactor/en-ca/lib/js/expression-editor.js:71:32 @http://192.168.0.13:8111/reactor/en-ca/lib/js/expression-editor.js:608:40 dispatch@http://192.168.0.13:8111/node_modules/jquery/dist/jquery.min.js:2:40040DuckDuckGo while clicking on status
http://192.168.0.13:8111/reactor/en-ca/lib/js/reactor-ui-status.js:789:44 asyncFunctionResume@[native code] saveGridLayout@[native code] dispatchEvent@[native code] _triggerEvent@http://192.168.0.13:8111/node_modules/gridstack/dist/gridstack.js:1401:30 _triggerAddEvent@http://192.168.0.13:8111/node_modules/gridstack/dist/gridstack.js:1383:31 makeWidget@http://192.168.0.13:8111/node_modules/gridstack/dist/gridstack.js:968:30 addWidget@http://192.168.0.13:8111/node_modules/gridstack/dist/gridstack.js:388:24 placeWidgetAdder@http://192.168.0.13:8111/reactor/en-ca/lib/js/reactor-ui-status.js:183:44Firefox while updating a rule
@http://192.168.0.13:8111/reactor/en-ca/lib/js/reaction-editor.js:543:91 makeExprMenu@http://192.168.0.13:8111/reactor/en-ca/lib/js/reaction-editor.js:537:28 @http://192.168.0.13:8111/reactor/en-ca/lib/js/reaction-editor.js:92:64 @http://192.168.0.13:8111/reactor/en-ca/lib/js/reaction-editor.js:89:68 each@http://192.168.0.13:8111/node_modules/jquery/dist/jquery.min.js:2:3133 @http://192.168.0.13:8111/reactor/en-ca/lib/js/reaction-editor.js:89:35 @http://192.168.0.13:8111/client/MessageBus.js:98:44 forEach@[native code] @http://192.168.0.13:8111/client/MessageBus.js:95:54 @http://192.168.0.13:8111/client/MessageBus.js:106:44 @http://192.168.0.13:8111/client/Observable.js:78:28 notifySaved@http://192.168.0.13:8111/reactor/en-ca/lib/js/ee.js:82:21 notifySaved@http://192.168.0.13:8111/reactor/en-ca/lib/js/expression-editor.js:47:26 @http://192.168.0.13:8111/reactor/en-ca/lib/js/reactor-ui-rules.js:1460:39 forEach@[native code] @http://192.168.0.13:8111/reactor/en-ca/lib/js/reactor-ui-rules.js:1459:58Chrome while creating/updating an expression
TypeError: Cannot read properties of undefined (reading 'getEditor') at RuleEditor.makeExprMenu (http://192.168.0.13:8111/reactor/en-ca/lib/js/rule-editor.js:1788:86) at Object.handler (http://192.168.0.13:8111/reactor/en-ca/lib/js/rule-editor.js:2174:54) at http://192.168.0.13:8111/client/MessageBus.js:98:44 at Array.forEach (<anonymous>) at MessageBus._sendToBus (http://192.168.0.13:8111/client/MessageBus.js:95:54) at MessageBus.send (http://192.168.0.13:8111/client/MessageBus.js:106:44) at ExpressionEditor.publish (http://192.168.0.13:8111/client/Observable.js:78:28) at ExpressionEditor.signalModified (http://192.168.0.13:8111/reactor/en-ca/lib/js/ee.js:146:14) at ExpressionEditor.signalModified (http://192.168.0.13:8111/reactor/en-ca/lib/js/expression-editor.js:40:15) at ExpressionEditor.reindexExpressions (http://192.168.0.13:8111/reactor/en-ca/lib/js/expression-editor.js:71:18) ``Not sure that it is the same issue but just got this on built 24302 when running a reaction for testing purpose. Despite the error message, the reaction ran properly.
Error: Command timeout (195 start_reaction)
at _ClientAPI._commandTimeout (http://192.168.2.163:8111/client/ClientAPI.js:552:136)
1a3422eb-d760-4609-a740-a40d04a6bab2-Screenshot 2024-12-29 231851.png
Thanks to @toggledbits for adding a custom CSS. I've started doing a darker Reactor style.
Here's the file: https://gist.github.com/dbochicchio/825098ac13b7f8cac22012eae37ff7ce
A couple of things are still too bright and I'll eventually catch-up. Just place it under your /config directory, naming the file as customstyles.css. Hard refresh your browser.
Hi
Having to rebuild my Linux Debian box as the SSD failed. And I have forgotten exactly what I did the first time to get it all setup.
I have Debian 12 up and running on the new SSD, I only have console no Desktop GUI.
I am trying to do the bare metal install for MSR. However I am not sure if I am meant to install nodejs whlist logged in as the root user or as the none root user with my name ?
I used putty and connected via SSH and logged in as root and I installed nodejs but I think this was wrong as when logged in as my user name and I do a node -v command it says node is not installed or doesn't show any version number anyway.
But when logged in as root and I do a node -v command it does show me its installed and displays the version number. maybe its a path issue for my username and he can't see node is installed?
So now I am thinking I should of installed node whilst logged in as my user name and not as the root user.
This is how I installed nodejs as whilst logged in as root
ac7bf6c3-23ad-46fc-8ada-44af6704e63e-image.png
Thanks in advance.
Build 21228 has been released. Docker images available from DockerHub as usual, and bare-metal packages here.
Home Assistant up to version 2021.8.6 supported; the online version of the manual will now state the current supported versions; Fix an error in OWMWeatherController that could cause it to stop updating; Unify the approach to entity filtering on all hub interface classes (controllers); this works for device entities only; it may be extended to other entities later; Improve error detail in messages for EzloController during auth phase; Add isRuleSet() and isRuleEnabled() functions to expressions extensions; Implement set action for lock and passage capabilities (makes them more easily scriptable in some cases); Fix a place in the UI where 24-hour time was not being displayed.As the title says, here's my OpenAI Controller for Reactor:
OpenAI Controller per Reactor. Contribute to dbochicchio/reactor-openai development by creating an account on GitHub.
It supports both OpenAI and Azure OpenAI endpoints. You'll need keys/endpoints, according to each service.
The controller supports multiple models, and each one could be mapped as an entity.
It's quite easy to use, and responses can be stored in variables, for easy access. Or sent to another action (Text To Speech, another endpoint, etc).
9013ae50-fd68-42a2-87c3-97479132e465-image.png
80a88eec-7c89-464a-8196-690b4b72d044-image.png
Have fun with LLM into your scenes!
In Home Assistant I have an integration that if I add entities to it, I will get the following error in MSR as certain entity values I'm using in expressions are null for a moment. This is more or less cosmetic issue and happens very rarely as I rarely modify that integration on the hass side.
Screenshot 2024-11-28 at 22.20.41.png
And the expression is
Screenshot 2024-11-28 at 22.38.19.png
Could I "wrap" hass-entity shown above somewhat differently to prevent this error from happening? Using build 24302.
Hello
I am trying to set up Multi System Reactor to automate routines across multiple smart home devices & platforms (e.g., Home Assistant, SmartThings, and Hubitat). While I have successfully linked the systems; I am facing issues with:
-Delays in triggering actions on secondary devices.
-Inconsistent execution of complex logic conditions.
-Synchronization of states between devices when one system updates.
Is there a recommended way to optimize performance & confirm seamless state sharing across systems?
I have checked https://smarthome.community/category/22/multi-system-reactor-msbi guide for reference but still need advice.
Any tips on debugging or log analysis to pinpoint where the issue arises would also be appreciated.
Thank you !
I've managed to use MSR UI on iOS devices to some degree*, so that although UI elements (e.g. rule sets) are not visible in portrait mode, you've seen them in landscape. Now with recents builds (24302) this does not work anymore, elements (rule sets, entities) are not anymore visible in landscape mode.
Does anyone have similar experiences? Using iOS 18 and Safari/Chrome browser.
( *Drag & drop of rule conditions have never worked on a mobile)
@toggledbits Since I have upgraded ZWaveJSController to 24293 from 24257 I am seeing entries related to registering action set_volume, but action is not defined by the capability 143 every time I restart Reactor.
The Siren seems to be doing what it is supposed to do. The volume levels are fine. Should I worry about it?
Reactor version 24302
ZWaveJSController version 24293
Z-Wave JS UI version 9.27.4
zwave-js version 14.3.4
I have the following ACL defined:
groups: admin: users: - admin applications: true api_acls: # This ACL allows users in the "admin" group to access the API - url: "/api" group: admin allow: true log: true # This ACL allows anyone/thing to access the /api/v1/alive API endpoint - url: "/api/v1/alive" allow: trueAnd I have authenticated to MSR as "admin" user. However, I'm getting "access denied" when trying to access http://*******:8111/api/v1/log
So what I'm missing, is my ACL incorrectly defined?
Using build 24302 on Docker.
Hi
I have just connected a bunch of EzloPi controllers to MSR to import some ESP based devices etc.
They all seemed to have worked and imported in to MSR apart from I have one missing device. It is a Digital Gas Sensor device.
This is how that device looks in the Ezlo API.
Devices Info:
_id: "10696001" deviceTypeId: "ezlopi" parentDeviceId: "10696000" category: "level_sensor" subcategory: "" gatewayId: "457a5069" batteryPowered: false name: "Gas Sensor Digital" type: "sensor" reachable: true persistent: true serviceNotification: false armed: false roomId: "" security: "no" ready: true status: "idle" parentRoom: true protectConfig: "default"Items Info:
_id: "20696001" deviceId: "10696001" hasGetter: true hasSetter: false name: "smoke_density" show: true valueType: "substance_amount" scale: "parts_per_million" value: 2.7472610473632812 valueFormatted: "2.75" status: "idle"There is also an Analog Gas sensor that one did import in to MSR OK.
68d63dab-b871-4f44-912b-cf6e0b9eb4c6-image.png
Devices Info:
_id: "10696000" deviceTypeId: "ezlopi" parentDeviceId: "10696000" category: "security_sensor" subcategory: "gas" gatewayId: "457a5069" batteryPowered: false name: "Gas Sensor Analog" type: "sensor" reachable: true persistent: true serviceNotification: false armed: false roomId: "" security: "no" ready: true status: "idle" parentRoom: true protectConfig: "default"Items Info:
_id: "20696000" deviceId: "10696000" hasGetter: true hasSetter: false name: "gas_alarm" show: true valueType: "token" enum: 0: "no_gas" 1: "combustible_gas_detected" 2: "toxic_gas_detected" 3: "unknown" valueFormatted: "no_gas" value: "no_gas" status: "idle"And this is how this MQ2 Gas Sensor looks like on their dashboard:
Digital
cb77dfa3-4af5-4d06-9635-89207a716a89-image.png
Analog
4fb4da1b-e946-4b89-876c-bcd9f5699b6c-image.png
They have an EzloPi website here you can create your own sensor projects using ESP boards, which is very interesting stuff!
And I just wrote on the Ezlo forum here, how to connect an EzloPi controller to MSR.
THANKS.
A couple of things for you @toggledbits, since you mentioned that this release has new features and some tweaks are expected.
Local expressions cannot be deleted. Pushing the X button has no effect for me.
When cloning an entity action, the result is strange (first is cloned one, second is the original action):
a92ea094-9e2c-4aaa-bf47-2d07a6ffdbd0-image.png
When changing the action on the cloned element, the params are added to the original one. See screenshot:
92ac3011-83c8-466b-bd23-47d483ad7a52-image.png
Dark theme has a couple of strange contrasts. One is visible in the previous screenshots (white text on yellow background). Another one is in groups (blue text on blue background):
9b3c4988-53ef-44e6-9672-30e744cacb75-image.png
Overall, I found blue, yellow, red and green (in buttons and forms) to be too bright.
On the bright side:
I love the new script action: thank you! The dark theme is a great start to avoid getting blinded at night I promise I'll try very soon the new features around actions. Thanks!@toggledbits
I just upgraded to version MSR 24293, bare metal running on Fedora. Upon restart, I am getting a error banner:
I followed the new directions about npm
npm i --no-save --no-package-lock --omit dev
Any idea what the issue is?
Seems like switching the UI to the newly added dark mode (thank you for this) does nothing. The UI stays in light mode and only a few buttons turn into dark mode (see screenshot)
Things I have tried:
Hard refresh
Different browser
Different computer
Restarting Reactor
Failed troubleshooting attempts:
No errors in Chrome console
No relevant errors in Reactor log (can still PM the full log file)
Reactor version: latest-24293-ea42a81d
Hardware: Odroid N2+
Linux version: Ubuntu 24.04.1 LTS
3df2806f-9146-485b-9ec1-d056e91cefe5-image.png Dark mode enabled
ff823023-c079-4684-b01f-d6ac6527d31a-image.png Light mode enabled
SOLVED: Use of multiple Hubitat hubs with MSR
-
Hello Everyone,
I currently use two Vera units in two structures, but am I able to use multiple Hubitat units with MSR as well?
I added a second Hubitat in another building, set it up as I setup up the first Hubitat, but I cannot seem to get it to connect. I have verified many times the correct URL and token is populated. Any ideas?
[latest-22069]2022-03-18T21:41:39.108Z <HubitatController:NOTICE> HubitatController#hubitatshop not ready; performing initial connect/query [latest-22069]2022-03-18T21:41:39.185Z <HubitatController:ERR> HubitatController#hubitatshop failed to connect/query http://10.10.10.86/apps/api/1: [FetchError]FetchError: request to https://10.10.10.86:5001/?access_token=798a073c-4021-43e3-9da7-c5c4ac4f141a failed, reason: certificate has expired [latest-22069]2022-03-18T21:41:39.186Z <HubitatController:CRIT> FetchError: request to https://10.10.10.86:5001/?access_token=798a073c-4021-43e3-9da7-c5c4ac4f141a failed, reason: certificate has expired FetchError: request to https://10.10.10.86:5001/?access_token=798a073c-4021-43e3-9da7-c5c4ac4f141a failed, reason: certificate has expired
Thanks!
-
@mikereadington I could be reading that wrong, but it looks like it's unhappy with the token. Have you tried recreating the token on the second Hubitat?
I'm using two Hubitats on one MSR and it works without a hitch. I did do the original recommendation of a second Maker API instance but @toggledbits advised that's no longer really necessary.
What does your configuration look like in
reactor.yaml
? -
Url should not be https
-
@toggledbits Totally missed that.
-
@toggledbits I get that, but I don't have HTTPS populated in the config. It looks like it checks HTTP, fails, then tries HTTPS.
Here is my config.
- id: hubitat enabled: true implementation: HubitatController name: A Hubitat Elevation system config: # Copy the entire URL from the Maker API app page on your Hubitat UI. A quick, easy way is to # right-click the "Get All Devices" link and choose "Copy link location", the paste it below. source: "http://10.10.10.85/apps/api/3/devices?access_token=1afd6778-a2ed-4323-9e81-f4e570d20082" # # dump_all_devices - This is for troubleshooting. Do not enable unless asked. dump_all_devices: false - id: hubitatshop enabled: true implementation: HubitatController name: Hubitat Elevation system config: # Copy the entire URL from the Maker API app page on your Hubitat UI. A quick, easy way is to # right-click the "Get All Devices" link and choose "Copy link location", the paste it below. source: "http://10.10.10.86/apps/api/1/devices?access_token=798a073c-4021-43e3-9da7-c5c4ac4f141a" # # dump_all_devices - This is for troubleshooting. Do not enable unless asked. dump_all_devices: false
-
None of this is adding up for me. You log previously shows that an attempt to connect on HTTPS is being made, and at that to the very unusual port 5001, yet your config (at least, what you've shown, which is only partial -- the error is for the controller config you have not shown us), shows HTTP and no port number. HubitatController handles the
source
URL very simply, and it contains no insertion of a port number (and 5001 specifically) anywhere in the code. Nor does HubitatController attempt both HTTP and HTTPS; it uses what you give it (and it expects HTTP only). So unless this is coming from hidden config, I have no idea where it's coming from. There's something more to your environment that you've disclosed here; I don't have enough information to provide you any further guidance, but based on what you've shown, in a normal (LAN, everything directly connected on the same network segment) environment this should just work as presented. But again, this isn't a complete picture, as the most vital information (config for the hub that actually is causing the error message you posted) isn't here.EDIT: Apologies! I could not see the scroll bar on the config (off screen) on the device I'm using. I see the config for that second unit. Still, no port number. No idea where https or 5001 is coming from; these are not things HubitatController does. This isn't adding up. Hmm... is the hub redirecting? Do you have some app or setting that is forcing a redirect to HTTPS?
-
Thanks Patrick,
Apologies are never necessary with me. You're on vaca, and this stuff isn't exactly running a nuclear power plant.
The MSR installation is about as vanilla as it could be. Docker on Synology, latest version, standard ports, with nothing optional added to it. The config file contains 3 Vera units (2 production, 1 test), 1 Hubitat (hopefully 2 at some point), and a weather subscription.
The network topology is also straightforward. MSR and this Hubitat are connected to the same physical switch with no VLANs in this segment. The range of 10.10.10.8X is what I use for automation devices, all devices are "on device" statically assigned, and those IPs are not within the range of the DHCP server. (I did also verify there is no duplication of IPs)
The first Hubitat (2.3.0.124) works with no issues. That unit is in service with devices and whatnot. (the Hub Information driver/device is installed)
The second Hubitat was taken out of the box, updated to 2.3.0.124, and I installed the Hub Information driver/device and the Maker API. I changed the MSR config to reflect the second unit as posted above, and here we are. I changed nothing else in this unit from out of the box, and I am 100% sure the token is accurate. When I browse to the hub over HTTP, it does not redirect to HTTPS. These two units are NOT meshed together, and if you remember back, I was the guy who had my Vera units bridged, which caused me some unexpected issues in the beginnings of MSR.
Anything I can think of that would affect the second hub should also affect the first hub, and I can't see why anything anywhere would redirect a request to HTTPS let alone an alternative port. I thought that might have been a failure model to retry with a secure connection if a failure occurred.
I know it's not magic, so something somewhere has to be doing this. @gwp1 confirmed he is using two with no issues, so it has to be something unique to me. I have been jammed up today, but I am going to take the first unit .85 out of the config and see if second one connects alone when the first is removed. If it does not, then it has to be something with that unit specifically.
Thanks again for trying to look at this, and thanks again for all you do with MSR.
-
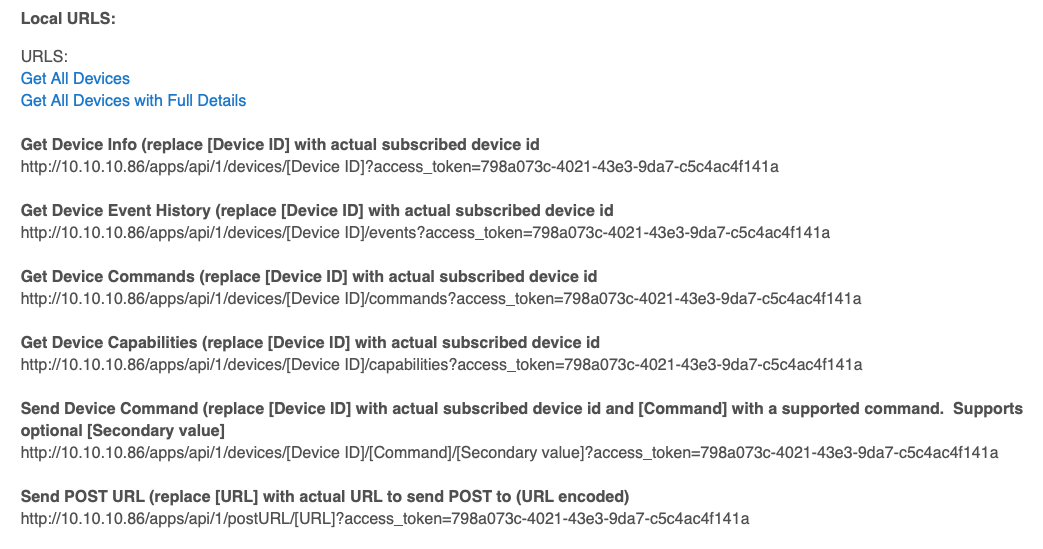
OK, so let's back up to the beginning. Can you a screen shot of the local access URLs from the Maker API on the new hub?
-
-
Sigh. I have a suspicion. And this is why I made the posting guidelines (which you didn't follow, and I didn't catch/stop until followed)...
Are you running on a Synology NAS, or at least, you have a Synology NAS in your network?
Edit: And yes, indeed you did say that in a follow-up post (7 posts in, but really need to have the info in the head post, up front), but in any case, there's the answer: your NAS is answering on that IP address. I don't know if that's a duplication of the IP (you said you didn't, but it can happen), or maybe a misconfig of the container somehow, no idea how, but the redirect URL is exactly what/how the NAS would respond if you sent the Maker API query URL to the NAS IP address (I was able to confirm exactly that by doing it to my own Synology NAS). Double-check the configuration of everything. The NAS should not be answering on that IP if that's really your new hub (or maybe, your new hub should not be on that address...?).
-
Thanks Patrick,
I am sorry I did not include everything in the first post. I know better, and for that I apologize.
There is 1 Synology NAS on site with only 1 connected network interface (10G copper) and that has a static set of IP address of 10.10.10.30. There were some test containers that were deleted from the system, but I don't know if there could still be something that could exist after a container is deleted. When I get in there tomorrow I will dig around and see what I find.
Thanks again
-
I did not have time to get into this until today, and this is something Synology owners should know.
I had two test containers that were shutdown, and one of them was a test Home Assistant on .86. After deleting the container, the issue persisted. I stopped and restarted the docker service, and it worked after that. I am a little puzzled by this because the contain was in the shutdown state, but for sure that container was the issue.
-
Good sleuthing. That's an interesting resolution. In a way it makes sense, because I could see docker reserving the resource (a network interface and its desired address) whether the container is running or not, but it's not the obvious thing for it to do (IMO), especially given that the side-effect is to let the host OS handle requests when the guest is down. That actually seems like is has potential security implications...
-