[Solved] Is there a cap or max number of devices a Global Reaction should not exceed?
-
@toggledbits hi master!
I am going into a state of despair with Hubitat, and thinking that I have made a bad switch from VeraPlus to Hubitat.
Well, as you always comment, look at the log, as I already commented my suspicion that the MSR sent all commands to Hubitat, and this one that failed was confirmed, as you mention in your message.
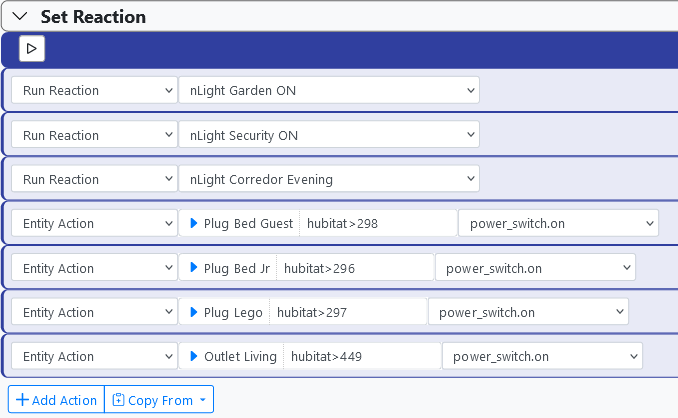
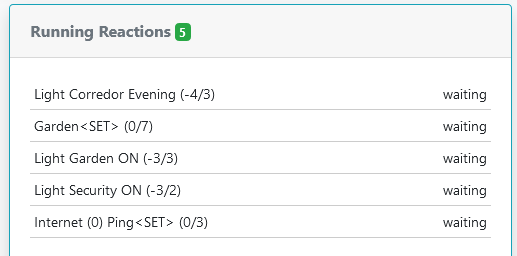
Routines below.
Looking at the log, I don't understand what sequence the MSR performed, but I see that all of the above actions were sent to Hubitat without fail.
[latest-21349]2021-12-17T01:46:57.319Z <Rule:NOTICE> Rule#rule-kx9oxcss configuration changed; reloading
[latest-21349]2021-12-17T01:46:57.321Z <Rule:NOTICE> Rule#rule-kx9oxcss stopping rule
[latest-21349]2021-12-17T01:46:57.324Z <Rule:NOTICE> Rule Rule#rule-kx9oxcss stopped
[latest-21349]2021-12-17T01:46:57.325Z <Rule:INFO> Rule#rule-kx9oxcss (nGarden) started
[latest-21349]2021-12-17T01:46:57.327Z <Rule:INFO> nGarden (Rule#rule-kx9oxcss) SET!
[latest-21349]2021-12-17T01:46:57.331Z <Engine:INFO> Enqueueing "nGarden<SET>" (rule-kx9oxcss:S)
[latest-21349]2021-12-17T01:46:57.345Z <Engine:NOTICE> Starting reaction nGarden<SET> (rule-kx9oxcss:S)
[latest-21349]2021-12-17T01:46:57.346Z <HubitatController:null> HubitatController#hubitat final action path for power_switch.on on Entity#hubitat>298: http://192.168.33.22/apps/api/67/devices/298/on
[latest-21349]2021-12-17T01:46:57.348Z <Engine:INFO> Enqueueing "nLight Garden ON" (re-kx65h5u7)
[latest-21349]2021-12-17T01:46:57.350Z <Engine:INFO> Enqueueing "nLight Security ON" (re-kx67amal)
[latest-21349]2021-12-17T01:46:57.352Z <Engine:INFO> Enqueueing "nLight Corredor Evening" (re-kx659j8a)
[latest-21349]2021-12-17T01:46:57.377Z <Engine:NOTICE> Resuming reaction nGarden<SET> (rule-kx9oxcss:S) from step 4
[latest-21349]2021-12-17T01:46:57.378Z <HubitatController:null> HubitatController#hubitat final action path for power_switch.on on Entity#hubitat>296: http://192.168.33.22/apps/api/67/devices/296/on
[latest-21349]2021-12-17T01:46:57.379Z <Engine:NOTICE> Starting reaction nLight Garden ON (re-kx65h5u7)
[latest-21349]2021-12-17T01:46:57.380Z <HubitatController:null> HubitatController#hubitat final action path for power_switch.on on Entity#hubitat>97: http://192.168.33.22/apps/api/67/devices/97/on
[latest-21349]2021-12-17T01:46:57.381Z <Engine:NOTICE> Starting reaction nLight Security ON (re-kx67amal)
[latest-21349]2021-12-17T01:46:57.382Z <HubitatController:null> HubitatController#hubitat final action path for power_switch.on on Entity#hubitat>197: http://192.168.33.22/apps/api/67/devices/197/on
[latest-21349]2021-12-17T01:46:57.383Z <Engine:NOTICE> Starting reaction nLight Corredor Evening (re-kx659j8a)
[latest-21349]2021-12-17T01:46:57.384Z <HubitatController:null> HubitatController#hubitat final action path for power_switch.on on Entity#hubitat>419: http://192.168.33.22/apps/api/67/devices/419/on
[latest-21349]2021-12-17T01:46:57.456Z <Engine:NOTICE> Resuming reaction nGarden<SET> (rule-kx9oxcss:S) from step 5
[latest-21349]2021-12-17T01:46:57.457Z <HubitatController:null> HubitatController#hubitat final action path for power_switch.on on Entity#hubitat>297: http://192.168.33.22/apps/api/67/devices/297/on
[latest-21349]2021-12-17T01:46:57.563Z <Engine:NOTICE> Resuming reaction nLight Garden ON (re-kx65h5u7) from step 1
[latest-21349]2021-12-17T01:46:57.564Z <HubitatController:null> HubitatController#hubitat final action path for power_switch.on on Entity#hubitat>162: http://192.168.33.22/apps/api/67/devices/162/on
[latest-21349]2021-12-17T01:46:57.673Z <Engine:NOTICE> Resuming reaction nLight Security ON (re-kx67amal) from step 1
[latest-21349]2021-12-17T01:46:57.674Z <HubitatController:null> HubitatController#hubitat final action path for power_switch.on on Entity#hubitat>229: http://192.168.33.22/apps/api/67/devices/229/on
[latest-21349]2021-12-17T01:46:57.782Z <Engine:NOTICE> Resuming reaction nLight Corredor Evening (re-kx659j8a) from step 1
[latest-21349]2021-12-17T01:46:57.784Z <Engine:NOTICE> nLight Corredor Evening delaying until 1639705619783<16/12/2021 20:46:59>
[latest-21349]2021-12-17T01:46:57.889Z <Engine:NOTICE> Resuming reaction nGarden<SET> (rule-kx9oxcss:S) from step 6
[latest-21349]2021-12-17T01:46:57.890Z <HubitatController:null> HubitatController#hubitat final action path for power_switch.on on Entity#hubitat>449: http://192.168.33.22/apps/api/67/devices/449/on
[latest-21349]2021-12-17T01:46:57.995Z <Engine:NOTICE> Resuming reaction nLight Garden ON (re-kx65h5u7) from step 2
[latest-21349]2021-12-17T01:46:57.996Z <HubitatController:null> HubitatController#hubitat final action path for power_switch.on on Entity#hubitat>385: http://192.168.33.22/apps/api/67/devices/385/on
[latest-21349]2021-12-17T01:46:58.106Z <Engine:NOTICE> Resuming reaction nLight Security ON (re-kx67amal) from step 2
[latest-21349]2021-12-17T01:46:58.106Z <Engine:INFO> nLight Security ON all actions completed.
[latest-21349]2021-12-17T01:46:58.214Z <Engine:NOTICE> Resuming reaction nGarden<SET> (rule-kx9oxcss:S) from step 7
[latest-21349]2021-12-17T01:46:58.215Z <Engine:INFO> nGarden<SET> all actions completed.
[latest-21349]2021-12-17T01:46:58.321Z <Engine:NOTICE> Resuming reaction nLight Garden ON (re-kx65h5u7) from step 3
[latest-21349]2021-12-17T01:46:58.322Z <Engine:INFO> nLight Garden ON all actions completed.
[latest-21349]2021-12-17T01:46:59.795Z <Engine:NOTICE> Resuming reaction nLight Corredor Evening (re-kx659j8a) from step 2
[latest-21349]2021-12-17T01:46:59.796Z <HubitatController:null> HubitatController#hubitat final action path for color_temperature.set on Entity#hubitat>419: http://192.168.33.22/apps/api/67/devices/419/setColorTemperature/2850
[latest-21349]2021-12-17T01:46:59.800Z <Engine:NOTICE> Resuming reaction nLight Corredor Evening (re-kx659j8a) from step 3
[latest-21349]2021-12-17T01:46:59.800Z <Engine:INFO> nLight Corredor Evening all actions completed.
I have checked each of the devices, all are in the log. I am even using the action_pace: 100 setting and I see that the interval was obeyed.
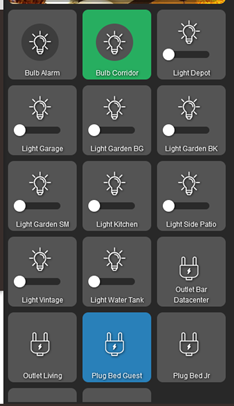
But out of 10 lights that should be on, as you can see on the Hubitat's panel only 2 were.
Sorry @toggledbits to ask, and I will understand if you don't answer because I see that the MSR is perfect.
Any recommendations for Hubitat? Reset the whole Z-wave radio and pair it again? Any APP that can check radio occupancy or Hubitat processing? Maybe you with your experience can give me some guidance, and again sorry, I know it is not MSR, but I'm almost back to the Vera with all its problems of drive and evolution.
@wmarcolin said in [Solved] Is there a cap or max number of devices a Global Reaction should not exceed?:
Looking at the log, I don't understand what sequence the MSR performed, but I see that all of the above actions were sent to Hubitat
Hmmm. I can't answer for the Hubitat part, but I explain the order. The first three actions in nGarden<SET> are Run Reaction, so these enqueue those reactions with the executive -- they are not run in-line. That's why you see the three "Enqueueing" lines, followed by a resume of nGarden<Set> from step 4. We see the action output for device 298, which is step 3 (numbered from 0), before the enqueue messages because enqueueing itself is an asynchronous operation, so the executive quickly started the three Run Reaction enqueue requests, then ran the device 298 Entity Action. Running an entity action is asynchronous, so the executive had to wait for that operation to finish. Since it went into a wait state, the tasks for the three Run Reaction enqueues could run, so they did. When they were done and the 298 device action was finished sending, nGarden<SET> could then resume from step 4 (numbered from 0, so 5 as we look at it). That's device 296 so we see that on the next line. Again, device actions have to wait for the send, so execution paused of nGarden<Set> paused there, which allowed nLight Garden ON, the first of the three enqueued reactions, to start and send its first command to device 97. That blocked that reaction, so nLight Security ON was next in the queue and it started and sent its first device action to 197. That blocked that reaction, so nLight Corredor Evening started and ran its first action against 419. It blocked, of course, so everything paused about 70ms until nGarden<Set> became the first ready task, so it resumed at step 5 (from 0, or 6 as we count from 1). And so on, until all were sent.
I'm not sure what your pacing configuration was at this point, but overall it appears about right for the number of tasks sent. It's hard to tell without more debug on, and maybe I'll add some "standard" messages about device queueing while we're looking at this (since debug on a Controller instance can be very large and a bit like sipping from a firehouse).
One thing to note also is that each Entity Action blocks while sending -- the reaction waits for the hub to acknowledge the request. For that to happen, the request must be sent, and the hub has to give an HTTP 200 (OK) response to the request (if it gives an error, that would be logged, and there are no errors logged in this snippet). So at the least, the hub has acknowledged the request, but that doesn't mean it has completed the request, let alone that the request was successful in its overall execution (e.g. manipulating the device). That's a different and much bigger problem.
I'm not done looking at this. I want to study the timing more carefully as well. There's something about it that doesn't seem right to me. As I said, I'm going to add some more standard (non-debug) diagnostic output to this while we're looking at it, and roll a new release later today, for you to try and send me new logs.
-
@wmarcolin I don't have a Hubitat myself but have you looked at the logs on the hub per https://docs.hubitat.com/index.php?title=Logs for hints of what is happening when set reaction fires?
-
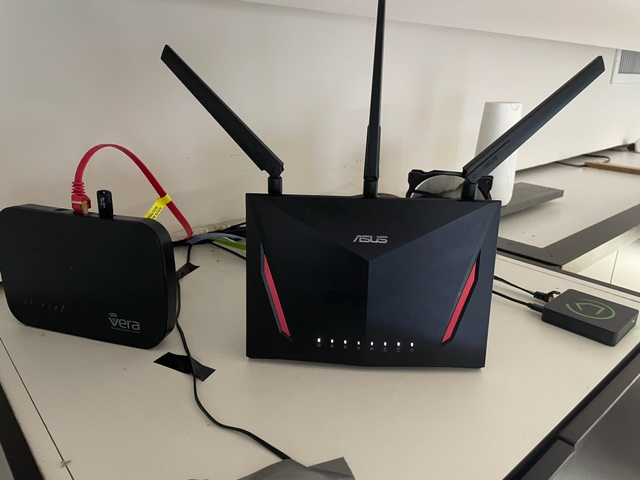
@wmarcolin Something you've not surfaced, wireless interference. How close is your Hubitat to your WiFi router (they should not be near each other as they will interfere due to the frequencies in use), how close are your z-wave hubs to each other, etc.
Are all devices the kind that are plugged into electricity? I've discovered with some battery-operated devices that they sleep a lot to conserve battery and that delays actions. My iblind controllers are a perfect example: sending a refresh first and then the command seems to make them much happier regarding responding to commands.
As @toggledbits noted in a response to me previously in the thread (and you've supported), the mesh plays a huge role, too.
I had a Veralite and then moved to a VeraSecure. I've done direct comparisons between my VeraSecure and Hubitat using MSR to trigger the rules and the Hubitat was much faster. That, amongst other reasons, is why my VeraSecure is now completely offline.
Ok, as you can see from the picture, my Hubitat is next to my Asus router, where the Vera Plus used to be. In theory radio waves from the router should interfere with the Zigbee because both frequencies are in 2.4, and should not in any way interfere with the Hubitat that works at a frequency of 900 Mhz. But I'm trying everything, and I've already moved the Hubitat 2 meters away from the router.
The vera was already disconnected and I have also removed it and put it away, who knows, maybe in the future I will find some use for it.
With respect to your comment of battery devices, I understand, but it is not the case, as I mentioned above I tried to make a sequence of lights, the 6 devices are 4 Aeontec Micro Switch G2 (DSC26103), 1 Zipato Bulb 2, and another Everspring AN145, that is all connected to the electricity all the time. Your battery point is very valid, but it is not what has caused me panic.
Finally, your comment about Hubitat being faster than Vera is what I read everywhere, but unfortunately, this is not what is happening to me at the moment. Slow reactions, even using Hubitat's own dashboard commands it takes a while for the action to happen, so I go back to the mesh network issue above. Maybe now moving it can help.
But still remains the question of the lack of response to MSR at the same speed.
I will now read the post of @toggledbits to see what he comments.
Thank you very much for your attention.
-
Build 21351 just posted. This has a fix for a problem in the setup of the task queue for HubitatController that is likely causing it to not pace as expected. Let's give this a try, and in addition, try a few different values for
action_pace. I would start from 25 and work up. -
@wmarcolin said in [Solved] Is there a cap or max number of devices a Global Reaction should not exceed?:
Looking at the log, I don't understand what sequence the MSR performed, but I see that all of the above actions were sent to Hubitat
Hmmm. I can't answer for the Hubitat part, but I explain the order. The first three actions in nGarden<SET> are Run Reaction, so these enqueue those reactions with the executive -- they are not run in-line. That's why you see the three "Enqueueing" lines, followed by a resume of nGarden<Set> from step 4. We see the action output for device 298, which is step 3 (numbered from 0), before the enqueue messages because enqueueing itself is an asynchronous operation, so the executive quickly started the three Run Reaction enqueue requests, then ran the device 298 Entity Action. Running an entity action is asynchronous, so the executive had to wait for that operation to finish. Since it went into a wait state, the tasks for the three Run Reaction enqueues could run, so they did. When they were done and the 298 device action was finished sending, nGarden<SET> could then resume from step 4 (numbered from 0, so 5 as we look at it). That's device 296 so we see that on the next line. Again, device actions have to wait for the send, so execution paused of nGarden<Set> paused there, which allowed nLight Garden ON, the first of the three enqueued reactions, to start and send its first command to device 97. That blocked that reaction, so nLight Security ON was next in the queue and it started and sent its first device action to 197. That blocked that reaction, so nLight Corredor Evening started and ran its first action against 419. It blocked, of course, so everything paused about 70ms until nGarden<Set> became the first ready task, so it resumed at step 5 (from 0, or 6 as we count from 1). And so on, until all were sent.
I'm not sure what your pacing configuration was at this point, but overall it appears about right for the number of tasks sent. It's hard to tell without more debug on, and maybe I'll add some "standard" messages about device queueing while we're looking at this (since debug on a Controller instance can be very large and a bit like sipping from a firehouse).
One thing to note also is that each Entity Action blocks while sending -- the reaction waits for the hub to acknowledge the request. For that to happen, the request must be sent, and the hub has to give an HTTP 200 (OK) response to the request (if it gives an error, that would be logged, and there are no errors logged in this snippet). So at the least, the hub has acknowledged the request, but that doesn't mean it has completed the request, let alone that the request was successful in its overall execution (e.g. manipulating the device). That's a different and much bigger problem.
I'm not done looking at this. I want to study the timing more carefully as well. There's something about it that doesn't seem right to me. As I said, I'm going to add some more standard (non-debug) diagnostic output to this while we're looking at it, and roll a new release later today, for you to try and send me new logs.
@toggledbits once again thank you for your kind attention.
What depends on me to send log, do tests I am at your disposal. Just tell me what I should do that I will be promptly attending.
@gwp1 in a previous message I had informed that I had moved Hubitat 2 meters away from my central office, which has my Asus router, no-break, the modems of the internet providers. I have just radicalized, and now the Hubitat is more than 20 meters away and open space, well away from all this magnetic field and radio frequency of a possible interference, let's see if this helps communication.
So now it remains to investigate why the very fast MSR running on a dedicated notebook (Intel(R) Core(TM) i5-3320M CPU @ 2.60GHz 8Gb RAM, 300Gb SSD), maybe running over the Hubitat.
Thanks
-
@toggledbits once again thank you for your kind attention.
What depends on me to send log, do tests I am at your disposal. Just tell me what I should do that I will be promptly attending.
@gwp1 in a previous message I had informed that I had moved Hubitat 2 meters away from my central office, which has my Asus router, no-break, the modems of the internet providers. I have just radicalized, and now the Hubitat is more than 20 meters away and open space, well away from all this magnetic field and radio frequency of a possible interference, let's see if this helps communication.
So now it remains to investigate why the very fast MSR running on a dedicated notebook (Intel(R) Core(TM) i5-3320M CPU @ 2.60GHz 8Gb RAM, 300Gb SSD), maybe running over the Hubitat.
Thanks
@wmarcolin said in [Solved] Is there a cap or max number of devices a Global Reaction should not exceed?:
Just tell me what I should do that I will be promptly attending.
You are always helpful, and that's appreciated. For the moment, just run it as it comes. Let's see what happens. Start with a 25 for
action_pace, and if you continue to have issues, move it up to 50. If 50 isn't enough, then I'll ask for logs. Let me know how it goes. -
@wmarcolin said in [Solved] Is there a cap or max number of devices a Global Reaction should not exceed?:
Just tell me what I should do that I will be promptly attending.
You are always helpful, and that's appreciated. For the moment, just run it as it comes. Let's see what happens. Start with a 25 for
action_pace, and if you continue to have issues, move it up to 50. If 50 isn't enough, then I'll ask for logs. Let me know how it goes.OK, changed action_pace to 25 (it was 100), and upgraded to build 21351.
-
@wmarcolin said in [Solved] Is there a cap or max number of devices a Global Reaction should not exceed?:
Just tell me what I should do that I will be promptly attending.
You are always helpful, and that's appreciated. For the moment, just run it as it comes. Let's see what happens. Start with a 25 for
action_pace, and if you continue to have issues, move it up to 50. If 50 isn't enough, then I'll ask for logs. Let me know how it goes.@toggledbits in this last upgrade process, I got these zombie processes. How is it possible to kill them? Thanks.
-
Stop Reactor. Then grab the
reactor.logfile and upload it to me. I'm going to DM you a link.After you've uploaded the log file, remove the
storage/states/reaction_queue.jsonfile and restart Reactor. -
Stop Reactor. Then grab the
reactor.logfile and upload it to me. I'm going to DM you a link.After you've uploaded the log file, remove the
storage/states/reaction_queue.jsonfile and restart Reactor.@toggledbits done boss!!
-
Stop Reactor. Then grab the
reactor.logfile and upload it to me. I'm going to DM you a link.After you've uploaded the log file, remove the
storage/states/reaction_queue.jsonfile and restart Reactor.I think that in another track you have also received this message, which is occurring exactly when running the above event of turning on several lights.
-
I think that in another track you have also received this message, which is occurring exactly when running the above event of turning on several lights.
@wmarcolin Very good. That means the more aggressive checks are working. It appears that Hubitat's event socket is a good bit more fragile than its Hass equal. I will add an option to the next release to silence this warning (although the reconnect will still be logged in the log file). You should also be able to see the effect of the reconnects on the system entity's
x_hubitat_sys.reconnectscounter.For comparison, I don't get these errors unless I force them. The one restart shown below was because I upgraded the hub to 2.3.0.120.
-
TL;DR: Hubitat needs more aggressive WebSocket connection health tests and recovery, and that's been added as of 21351. When recovery is needed (which should be very rare), device states may be delayed up to 120 seconds. Don't use WiFi for your Reactor host or hub in production. If your Reactor host and hub aren't on the same network segment (LAN), you may see more reconnects. If you see reconnects when your Reactor host and hub are on the same network segment, you likely have a network quality issue.
I want to explain how I understand the problem reported, and how the fix (which is more of a workaround) works.
The events websocket is one of two channels used by HubitatController to get data from the hub. When HubitatController connects to the hub, it begins with a query to MakerAPI to fetch the bulk data for all devices -- "give me everything". Thereafter, the events socket provides (only) updates (changes). Being a WebSocket connection, it has a standard-required implementation of ping-pong that both serves to keep the connection alive and test the health of the connection. In Reactor, I use a standard library to provide the WebSocket implementation, and this library is in wide use, so while it's almost certainly not bug free (nothing is), it has sufficient exposure to be considered trustworthy. I imagine Hubitat does the same thing, but since it's a closed system, I don't know for sure; they may use something common, or they may have rolled their own, or they may have chosen some black sheep from among many choices for whatever reason. In any case, neither Hubitat nor Reactor implement the WebSocket protocol itself, we just use our respective WebSocket libraries to open and manage the connections and send/receive data.
Apparently there is a failure mode for the connection, and we don't know if it's on the Hubitat (Java) side or in the nodejs package, where the events can stop coming, but apparently the ping-pong mechanism continues to work for the connection, otherwise it would be torn down/flagged as closed/error by the libraries on both ends. There's no easy way to tell if Hubitat has stopped sending messages or the nodejs library has stopped receiving or passing them, and since the libraries/packages on both ends are black boxes as far as I'm concerned, I don't really care, I just want it to work better. So...
HubitatController versions prior to 21351 relied solely on the WebSocket's native ping-pong mechanism to describe connection health, as Reactor does for Hass and even its own UI-to-Engine connection (lending credence to the theory that the nodejs library is not the cause). But for Hubitat it appears the WebSocket ping-pong alone is not enough, so 21351 has introduced some additional tests at the application layer. If any of these fails, the connections are closed and re-opened. When reopened, a full device/state inventory is done again as usual, so the current state of all devices is reestablished. Any missed device updates during the "dead time" would be corrected by this inventory.
By the way, one of the things that exacerbates the problem with the Hubitat events WebSocket is that it's a one-way connection at its application later: Hubitat only transmits. There is no message I can send over the WebSocket for which I could expect a speedy reply as proof of health. I have to find other things to do through MakerAPI in an attempt to force Hubitat to send me data over the WebSocket, and this takes more time as well. If there was two-way communication, it would be a lot easier and faster to know if the connection was healthy.
So the question that remains, then, is what is that timing? By default, HubitatController will start its aggressive recovery at 60 seconds of channel silence. If the channel then remains silent for an additional 60 seconds, the close/re-open recovery occurs. So even if the connection fails, the maximum time to recovery and correct state of all devices will be just over 120 seconds. So even in worst-case conditions, entity states should not lag more than that. Given that these stalls are the exception rather than the rule for most users, these pauses should be rare.
There is one tuning parameter that may be useful to set on VPN connections or any other "distanced" connection (i.e. any connection where the Reactor host and the hub are not on the same network segment, and in particular may traverse connection-managing software or hardware like proxies, stateful packet inspection and intrusion detection systems, load balancers, etc.). That is
websocket_ping_interval, which will be added to the next build. This will set the interval, in milliseconds, between pings (default 60000). This should be sufficiently narrow to prevent some VPNs from aborting the socket in some cases (see the WebSocket missive at the end), but if not, smaller values can be tried, at the expense of additional network traffic and a slight touch on CPU. If the reconnects don't improve significantly, a different VPN option should be chosen.And this brings me to two recommendations:
- You should not use a WiFi connection for either the Reactor host or hub in production use. These are fine for testing and experimentation, but are an inappropriate choice in production for both reliability and performance reasons.
- If you use a VPN between the Reactor host and the hub, "subscription VPNs" are probably best avoided, as these will be the most aggressive in connection management and cause the most disconnects and failures. That's because they are tuned for surfing web traffic and checking email, basically, where the connections are open-query-response-close — connections don't stay open very long, typically. There are optimizations of HTTP where connections are kept open after a response to allow for a follow-up query (e.g. request an embedded image after requesting a document), but these are generally much shorter than the expected infinite open of a WebSocket connection (more on this at the bottom). Point-to-point VPNs that you set up and manage yourself are likely to provide better stability and performance (e.g. PPTP, SSH tunnels, etc.).
I will also add this: in my network, I do not get Hubitat WebSocket stalls and reconnects. I have had to force them through various devious means to test the behavior I've just implemented. I owned a commercial data center in the San Francisco Bay Area, with a managed network offered to clients with 100% uptime service level agreements. I built and maintained that network. My home network is a reflection of that — good quality equipment, meticulous cabling, sensible architecture (scaled down appropriately for the lesser scope and demands), and active data collection and monitoring. My network runs clean, and when there are problems, I know it (and where). If your Reactor host and Hubitat hub are on the same network segment, hardwired and not WiFi, and you are getting reconnects, I think you should audit your network quality. Something isn't happy. It only takes one bad cable, or one bad connector on one end of one cable, to cause a lot of problems.
---
For anyone interested, one reason why WebSockets can be troublesome in network environments where connection management may be done between the endpoints is that a WebSocket typically begins its life as an HTTP request. The client makes an HTTP request to the server with specific headers that ask that the connection to be "converted" (they call it "upgraded") from HTTP to WebSocket. If the server agrees, the connection becomes persistent and a new session layer is introduced. But because the connection starts as HTTP, any interstitial proxy or device that is managing the connection as it passes through may mistake it for a plain HTTP (web page) request, and when the connection doesn't tear itself down after a short period the proxy/device thinks is reasonable for HTTP requests, it forces the issue and sends a disconnect to both ends. This is necessary because tracking open connections consumes memory and CPU on these devices, and in a commercial ISP environment this could mean tens of thousands or hundreds of thousands of open connections at a single interface/gateway. So to keep from being overwhelmed, these devices may just time out those connections (on a predictable schedule/timeout, or just due to load), but because it's not really an HTTP connection at that point (it's been upgraded to a WebSocket), the proxy/device is breaking a connection that both the server and client expect to be persistent, and that can then cause all kinds of problems, the most benign of which is forcing the two endpoints to reconnect frequently and waste a lot of time and bandwidth doing it. On a LAN, you typically don't have these problems, because the two endpoints have no stateful management between them (network switches, if present between, just pass traffic, not manage connections), so barring network problems, there's no reason for them to be disconnected until either asks to close.
@toggledbits master!
Another lesson in knowledge, and dedication to understanding and solving problems.
Well, I spent two days reading your post before trying to answer anything.
First starting from the end, in my case my network is all Giga, CAT7 cables with industrial connectors. All the cabling of the house came with cables ready to not run the risk of redoing connectors. Then I even hired a company to certify the network, which also uses management switches that I can validate the network. So ping inside my house between any equipment is < 1ms.
From the technical side what I see is that the connection between MSR and Hubitat is fragile, and it becomes even more so when MSR is much faster in its actions without Hubitat responses.
What you would be doing for a future version is strengthening the validation of this communication, in particular, to return the status of given orders. That is, if you tell the MSR to turn on a light, make sure that the return state says that the light is on.
I was in doubt, in case of saying that it was not turned on, would there be a reset? Could this be a summary?
-
@toggledbits master!
Another lesson in knowledge, and dedication to understanding and solving problems.
Well, I spent two days reading your post before trying to answer anything.
First starting from the end, in my case my network is all Giga, CAT7 cables with industrial connectors. All the cabling of the house came with cables ready to not run the risk of redoing connectors. Then I even hired a company to certify the network, which also uses management switches that I can validate the network. So ping inside my house between any equipment is < 1ms.
From the technical side what I see is that the connection between MSR and Hubitat is fragile, and it becomes even more so when MSR is much faster in its actions without Hubitat responses.
What you would be doing for a future version is strengthening the validation of this communication, in particular, to return the status of given orders. That is, if you tell the MSR to turn on a light, make sure that the return state says that the light is on.
I was in doubt, in case of saying that it was not turned on, would there be a reset? Could this be a summary?
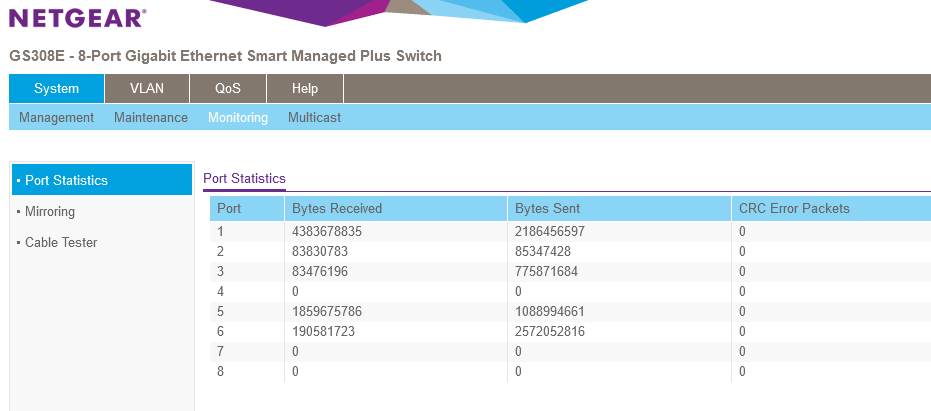
Ping (and traceroute) are not network quality tools. They are path tools. To measure link quality, since you said you had managed switches, you'd need to look at the error counts on each port. That may be worth a squiz.
As @Alan_F has observed, you can get restarts from a quiet channel that is just naturally quiet. If you don't have a lot of devices, and things aren't changing often, it's very likely to see a quiet channel. HubitatController probes by picking a device and making it refresh, which usually causes some event activity on the WebSocket channel. But it's possible that the device it picks (randomly) may not do much when refreshed. You can set
probe_deviceto the device ID (number) of a device that consistently causes events when asked to refresh to mitigate that random effect. That may take some experimentation, using the Hubitat UI to ask devices to refresh, and watching for green highlights in the Reactor Entities list. When you find a device that consistent "lights" when you refresh it on Hubitat, you've probably got a reliable probe device.I have noted in my own network that certain devices (that shall be unnamed) are sufficiently chatty that I'm at no risk of a quiet channel. Let's just say anything that monitors energy is a good canary in the mine.
-
Ping (and traceroute) are not network quality tools. They are path tools. To measure link quality, since you said you had managed switches, you'd need to look at the error counts on each port. That may be worth a squiz.
As @Alan_F has observed, you can get restarts from a quiet channel that is just naturally quiet. If you don't have a lot of devices, and things aren't changing often, it's very likely to see a quiet channel. HubitatController probes by picking a device and making it refresh, which usually causes some event activity on the WebSocket channel. But it's possible that the device it picks (randomly) may not do much when refreshed. You can set
probe_deviceto the device ID (number) of a device that consistently causes events when asked to refresh to mitigate that random effect. That may take some experimentation, using the Hubitat UI to ask devices to refresh, and watching for green highlights in the Reactor Entities list. When you find a device that consistent "lights" when you refresh it on Hubitat, you've probably got a reliable probe device.I have noted in my own network that certain devices (that shall be unnamed) are sufficiently chatty that I'm at no risk of a quiet channel. Let's just say anything that monitors energy is a good canary in the mine.
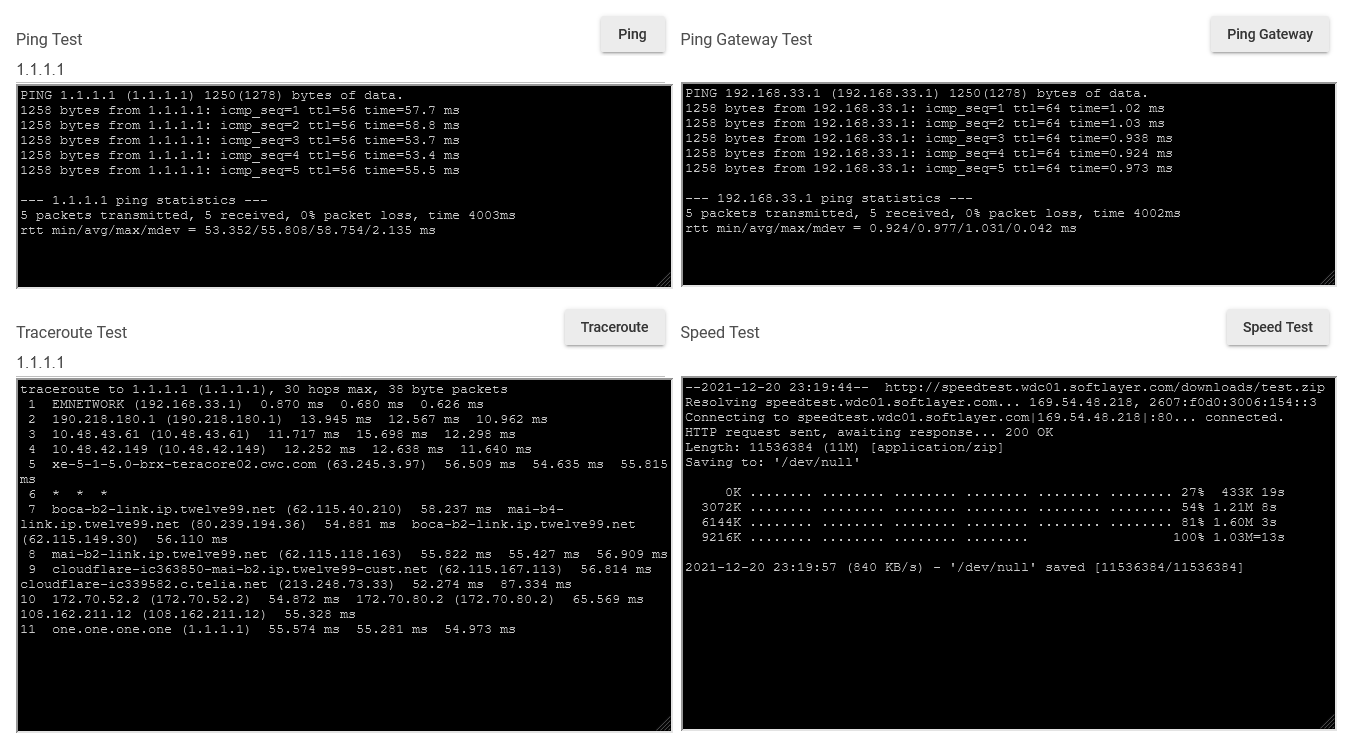
The ping tests were to validate the connection, speed, below is the screen of the switch that the MSR and Hubitat are on, no errors. I have a weekly reset programmed, so this information is from last Friday until now.
Ok, so what I should set now is a device connection probe, something like the APP Device Watchdog. I'm going this way.
Anyway, I think I mentioned before, I ended up moving Hubitat far away from my wifi router on Saturday, and since last night after deactivating the devices again one by one, I started rebuilding my mesh. I already see good results with the move away, several devices that previously had trouble responding, now seem to work better. Hopefully, by Wednesday I will have finished the rebuild, and will be able to check how the network behavior and ping-pong between MSR and Hubitat is now with the latest version of MSR.
Thanks.
-
Very good. In my limited experience with this new heuristic, Z-Wave devices seem to be the most predictable for probes among the basic devices. In the current build, whatever you choose must support the
Refresh(Hubitat native) capability (akax_hubitat_Refreshin Reactor). In the next build, the config valueprobe_actionwill be available to let you use a different action, if you need to, andprobe_parameters(an object) containing any key/value parameter pairs that the command may need (optional).I've also found that the "Hub Information" app (or more correctly, the device that this app manages) makes a good probe target. It has some useful data, and also very reliably updates fields when commanded to do so, even at a high frequency, so the next build will have specific support for this app/device if it finds it among the hub's inventory.
@toggledbits hi!
I have been operating for two days with version 23360, and the chaos described in the messages above is no longer happening. The recurrent failures of leaving an action without executing as a whole are no longer oberved.
Thanks for all your efforts!
A question, in version 21353 we started seeing the message below, which you made possible after deactivating the alert.
Is it possible to make some kind of query, or trigger some action when this message happens? I would like for example to send a Telegram to notify me.
Thanks.
-
Yes, there are at least two ways to do that now. Any thoughts on where you might look?
Edit: Same question as this thread: https://smarthome.community/topic/832/identifying-when-msr-cannot-connect-to-home-assistant
And this thread is wandering, so maybe let's leave it alone.
-
 T toggledbits unlocked this topic on
-
Yes, there are at least two ways to do that now. Any thoughts on where you might look?
Edit: Same question as this thread: https://smarthome.community/topic/832/identifying-when-msr-cannot-connect-to-home-assistant
And this thread is wandering, so maybe let's leave it alone.
Hi, I asked @toggledbits to reopen this very long thread, to give a testimony of a situation that I believe can help others.
I apologize for the long message, let's recapitulate the history.
The discussion was based on possible device limits on MSR actions, which Patrick explained there would not be, but the situation described was very similar to the scenario I posted in my message, of numerous failures on actions sent from MSR to Hubitat (December 16, 12:28am). That MSR was much faster than Hubitat could process.
I posted an example where I had to execute a series of Reactions that would turn on lights, and also turn on outlets, it always failed, I demonstrated that the MSR would activate everything, but Hubitat would not execute.
Then came the topic and orientation that my Hubitat should not be next to my WiFi router that could be interfering with the Hubitat signal, I even sent a picture on December 17 and provided the change %(#ff8000)[(TIP 1)].
Well obviously, as the change of position was big, I had to redo 3 times the entire mesh network, adding and removing devices. I followed the instruction of many masters, do the network from the center, i.e., from Hubitat to the outside, including first devices that use electric power because they are repeaters, and then those with exclusive battery power %(#ff8000)[(TIP 2)].
Well, our friend Patrick releases version 21351 and then 23360 where he adds much more aggressive management in the communication MSR x Hubitat, it improved a lot. But unfortunately, I kept having problems.
Then I asked for help again to go forward and see what to do to improve, we entered in the theme that several posts from the Hubitat community mentioned devices that use the S0 security, that this creates problems in the mesh network by high traffic of unnecessary information, new action remove and include again the devices that had S0 %(#ff8000)[(TIP 3)], another action that helped the network. What was not possible, we reactivated the Vera hub and put these devices back in, removing them from the Hubitat network.
We were evolving, but the situation persisted, actions that triggered many actions to Hubitat could still have failures, and the worst actions using Hubitat's own dashboard were also not being executed.
Well, I returned to the discussion of when I changed the Vera to Hubitat, which highlighted several points of change, but one very bothered me, the Hubitat Z-Wave signal, much weaker than the vera (https://smarthome.community/topic/776/switching-from-vera-to-hubitat/9?_=1644189698709).
Well 4 days ago (2/2), moved by the courage I opened my Hubitat and followed the post (https://community.hubitat.com/t/external-antenna/81396/28) %(#ff8000)[(TIP 4)], and installed an external antenna for z-wave, here I show that I bought and installed (https://community.hubitat.com/t/elevation-c7-possible-faulty-z-wave-radio/52977/91). In this post the discussion started with the theme S0 and S2, and went into the antenna theme.
MY TESTIMONY OF WHAT HAPPENED
A revolution, my Hubitat got a new life, it is another equipment:
- Before I had 15 direct devices in the hub, today after 4 days there are already 36 of 64, and I see that every day is increasing as the network is being restructured. There was the absurdity of equipment in the same environment as the HE, but behind a column, using two other devices to reach the HE that was less than 4 meters away, now communicates directly;
- There was almost no equipment that communicated at 100kbps, most were between 9.6 and 40, now most are already 100, and a small number, 5/64 are at 9.6 kbps;
- Remember the thing where I had to turn on several lights and power outlets all together? it didn't fail anymore, as the devices speak better and faster like the HE, I don't see this failure anymore;
- I also talked about actions commanded by the Dashboard that the device did not respond to, it is not happening anymore either.
In summary, in my case that 3/4 of the devices are not repeaters, they use batteries, my z-wave mesh network had a lack of repeaters, and this generated a generalized degradation. Now, with this better signal, if not eliminated the problem, I reduced it to almost zero.
Now pay attention, the operation of putting up the external antenna seems simple, but it is not. The antenna connector that is soldered to the board is very small and difficult to handle. So if you go this way, look for a cell phone repair shop, they will surely have the best technique for this change.
Thank you, and sorry again for the long message.
@gwp1 maybe this can help if you still have a problem. Your tip to move the HE away from the Wifi was also precious, thank you.
@SweetGenius your comment that there might be an overwhelming in the hub was correct, the action_pace action was a help, but the signal improvement I describe was the solution when I have a more fast response of the devices, reducing the overwhelm. Thanks.
@toggledbits our last messages, before I wanted to incinerate Hubitat, also helped a lot on the way. Thank you for all your dedication.

