
Trying to setup InfluxDB breaks my MSR install
-
Hi
I've just done a clean install of Bullseye OS on my Raspberry Pi and I am trying to setup MSR with InfluxDB.
I have managed to get the old VeraFlux plugin working OK with the new InfluxDB installation on the Pi, so think I have the InfluxDB installation correct and working.
However ideally I'd like to use MSR instead. I created a "reactor" database and created a username and password.
In the reactor config file I added this at the end of it
plugins:
- id: influx
  name: InfluxDB 1.x Feed
  enabled: true
  implementation: InfluxFeed
   config:
    influx_url: http://192.168.0.36:8086
    influx_database: reactor
    influx_username: myuser
    influx_password: "mypassword"  # note use of quotes
However when I restart MSR it doesn't come back up again. If I comment out all of that plugins section in the config file and restart the box, then MSR loads OK again. So I must be doing something wrong?
Influx running on the Pi is version 1.8.10.
MSR is running on a different Linux Debian box.
Not sure how to update to InfluxDB 2.0, maybe I should do that?
I looked in the log file and searched for "Influx" but nothing was found.
Thanks
-
Check that you don't have tabs instead of spaces in your indenting. You can check
/var/log/syslogfor additional startup errors.Also did you run the install script?
Edit: just noticed that
configand all below are not correctly indented. -
Did I run the install script? No I haven't.
Is it a separate install now for the InfluxDB plugin? And how do you do it?
The help page just says
"At the moment, InfluxFeed is included in all Reactor distributions. In a future release, it will be a separately-installed component"
-
MSR is starting now, I think my reactor.yaml config file was a bit out of date. I just copied the whole plugins section from the dist-config reactor.yaml file version and pasted it in to mine and then edited it. Now MSR is starting up again OK.
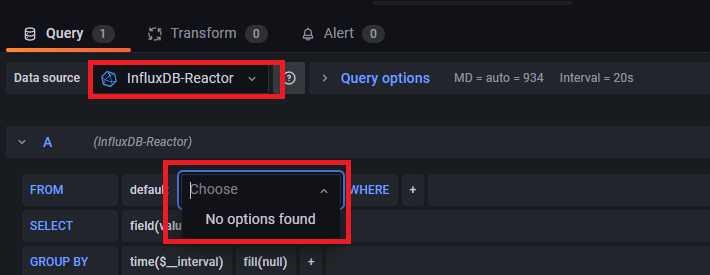
I've just connected Grafana to the "reactor" DB source on InfluxDB OK. But as yet no measurements are appearing yet for some reason. I'm not sure if MSR is actually outputting data or how to check it, other than trying to do a query in Grafana.
Only thing I wasn't sure about was this:
influx_org - Organization ID (required)
influx_org: "<your-influx-organization>" -
Maybe the plugin isn't actually installed then. I see this in the MSR log:
[latest-22004]2022-01-19T17:07:24.636Z <app:ERR> Trapped unhandled Promise rejection: [Error]Error: Cannot find module '@influxdata/influxdb-client' Require stack: - /home/stuart/reactor/server/lib/InfluxFeed.js [latest-22004]2022-01-19T17:07:24.637Z <app:ERR> Please refer to the console log for trace [latest-22004]2022-01-19T17:07:24.762Z <app:ERR> Trapped unhandled Promise rejection: [Error]Error: Cannot find module '@influxdata/influxdb-client' Require stack: - /home/stuart/reactor/server/lib/InfluxFeed.js [latest-22004]2022-01-19T17:07:24.762Z <app:ERR> Please refer to the console log for trace [latest-22004]2022-01-19T17:07:24.818Z <app:ERR> Trapped unhandled Promise rejection: [Error]Error: Cannot find module '@influxdata/influxdb-client' Require stack: - /home/stuart/reactor/server/lib/InfluxFeed.js [latest-22004]2022-01-19T17:07:24.818Z <app:ERR> Please refer to the console log for trace [latest-22004]2022-01-19T17:07:24.865Z <app:ERR> Trapped unhandled Promise rejection: [Error]Error: Cannot find module '@influxdata/influxdb-client' Require stack: - /home/stuart/reactor/server/lib/InfluxFeed.js [latest-22004]2022-01-19T17:07:24.867Z <app:ERR> Please refer to the console log for trace -
I meant the Reactor install script for RPi. Missing packages are usually a failure to complete the install. See the docs.
Author of Multi-system Reactor and Reactor, DelayLight, Switchboard, and about a dozen other plugins that run on Vera and openLuup.
-
I meant the Reactor install script for RPi. Missing packages are usually a failure to complete the install. See the docs.
@toggledbits said in Trying to setup InfluxDB breaks my MSR install:
I meant the Reactor install script for RPi
MSR isn't running on the Pi. Its running on a bare metal Linux Debian box, version is 22004-6d6c6b7.
InfluxDB is running on a Pi however.
-
OK, but the point is the same. The error message suggests that the install steps on the Debian side weren't done, and one step in particular, step 6. The dependencies for Reactor haven't been installed, or may be very out of date (there have been several releases where I've recommended running
npmto update them).Author of Multi-system Reactor and Reactor, DelayLight, Switchboard, and about a dozen other plugins that run on Vera and openLuup.
-
OK, but the point is the same. The error message suggests that the install steps on the Debian side weren't done, and one step in particular, step 6. The dependencies for Reactor haven't been installed, or may be very out of date (there have been several releases where I've recommended running
npmto update them).Thank you, that was the bit I wasn't sure how to do.
It seems to be working now and populating stuff in Grafana from the "Reactor" DB.
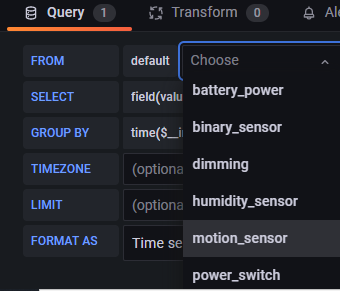
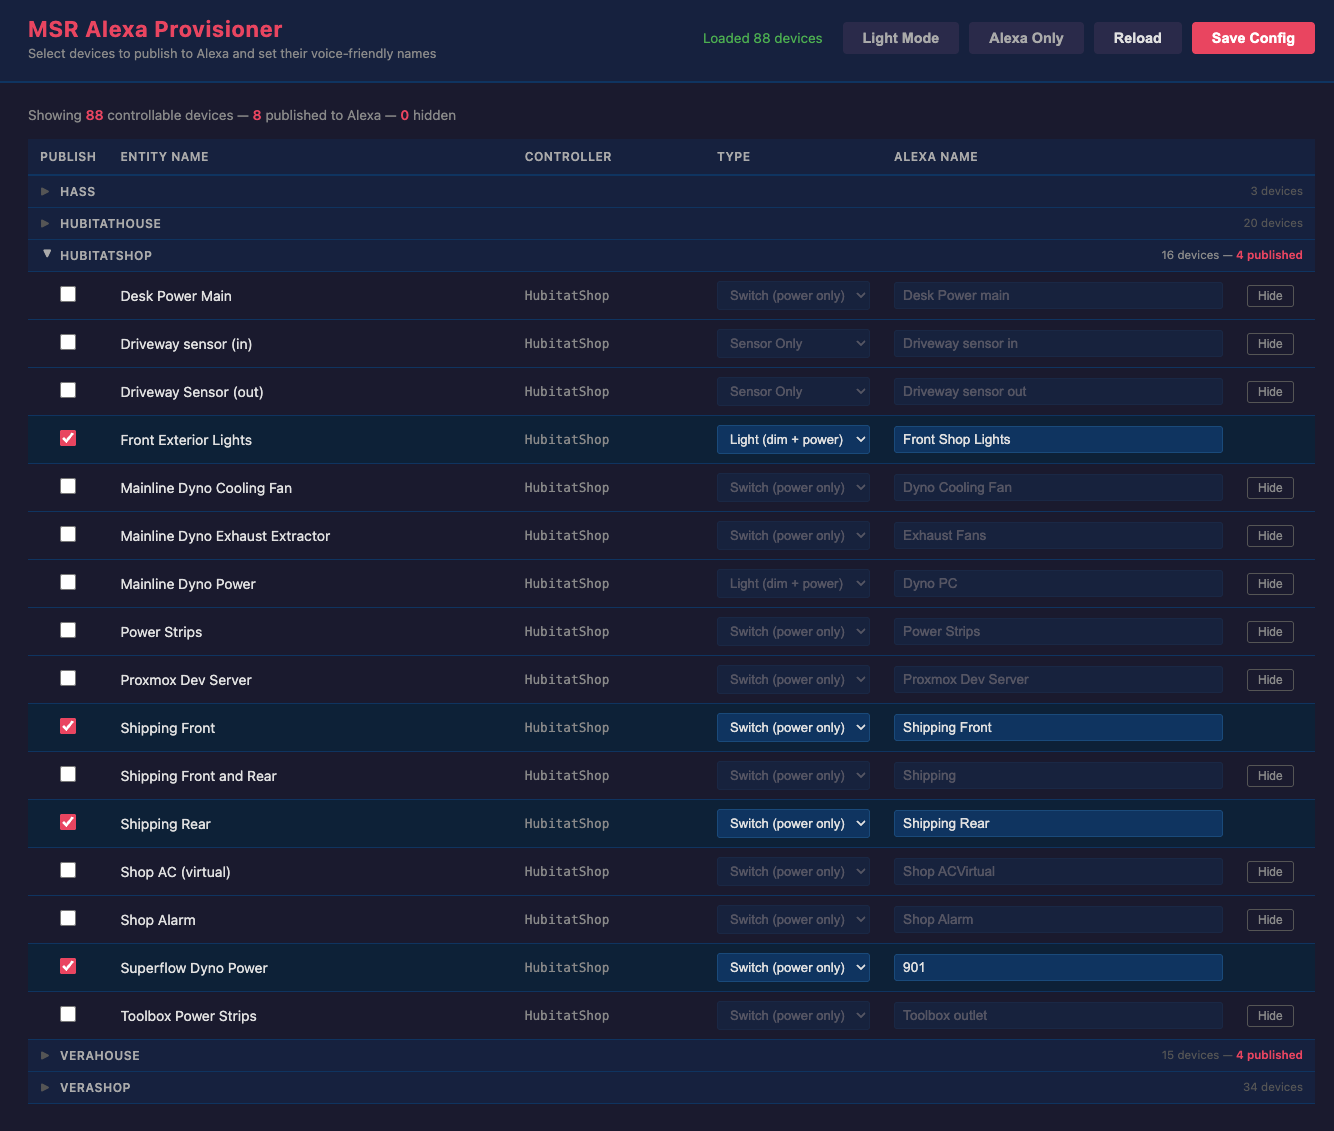
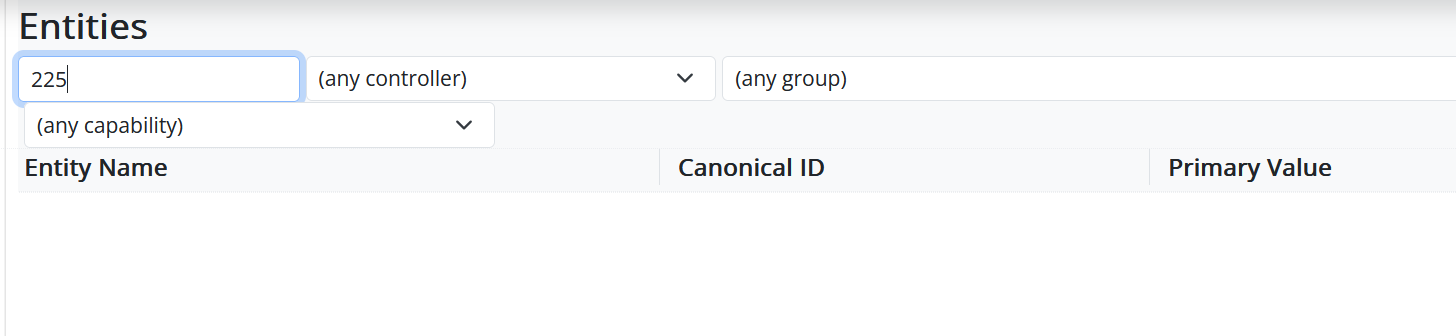
Is that all the device capabilities available in that screen shot? For example could we add a Light Level Sensor (LUX) in to a graph ? I tired binary_sensor but could not see any LUX sensors under "name" or under "entity" and looking for the Vera device ID number I wanted.
I able to do that using the old VeraFlux plugin earlier. But I want to ditch that plugin now and just use MSR ideally.
Thank you.
-
Thank you, that was the bit I wasn't sure how to do.
It seems to be working now and populating stuff in Grafana from the "Reactor" DB.
Is that all the device capabilities available in that screen shot? For example could we add a Light Level Sensor (LUX) in to a graph ? I tired binary_sensor but could not see any LUX sensors under "name" or under "entity" and looking for the Vera device ID number I wanted.
I able to do that using the old VeraFlux plugin earlier. But I want to ditch that plugin now and just use MSR ideally.
Thank you.
@cw-kid said in Trying to setup InfluxDB breaks my MSR install:
Is that all the device capabilities available in that screen shot? For example could we add a Light Level Sensor (LUX) in to a graph ?
The docs describe how to select capabilities for export. The section after also describes how to restrict which entities are exported, if that's an additional thing you may want to do.
-
No worries. I just don't want to rehash, and if the docs end up not being adequate, I want to know that, too. The abbreviated default list of capabilities is to avoid the "sipping from a firehose" effect... as I think you've seen on the Recently Changed Entities list on the Status page, device changes are many and frequent, especially from Vera hubs (much of it caused by polling and the resultant updating of polling state/control variables that most people don't care about).
-
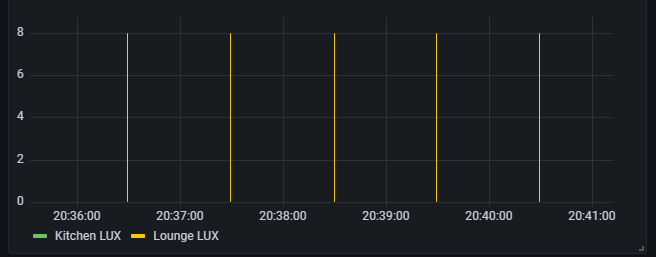
OK that works these values are coming from MSR now via Vera Plus hub
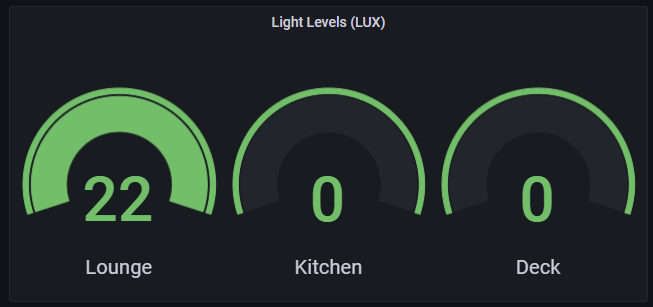
I added this in to the reactor.yaml file
config:
      select_capabilities:
        light_sensor: true
I will have a play about with it all, as I have forgotten how to use Grafana properly and its changed a bit since last time I used it.
-
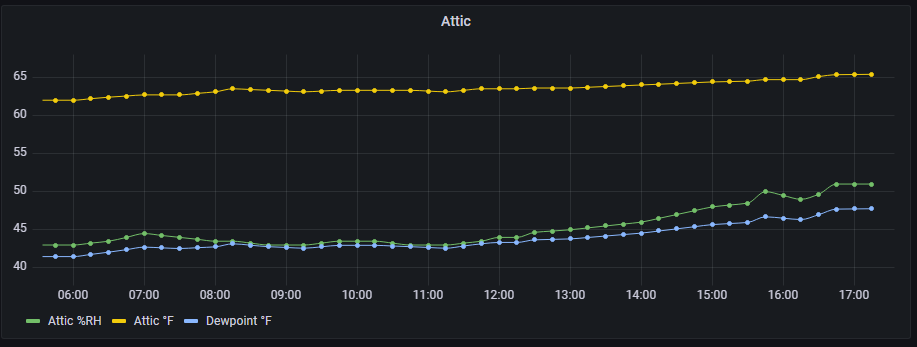
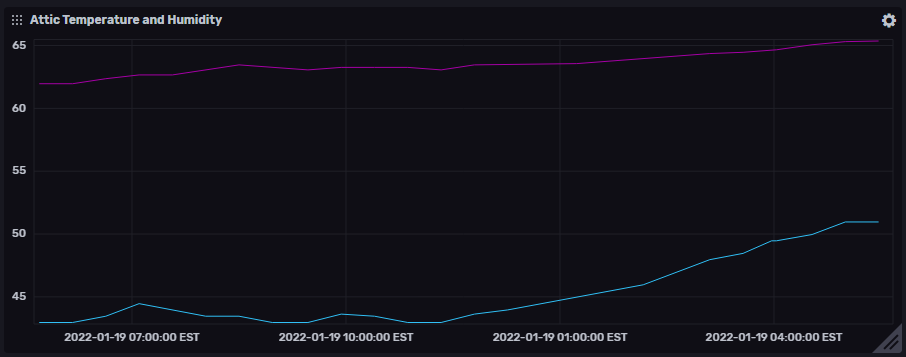
FYI only/anecdotally: I am using both 1.8 with Grafana and 2.0 with it's native graphing. Grafana is subtly prettier, for sure, but I'm not sure it outweighs the convenience of having one less piece of software to install. The only thing I haven't verified for 2.0's graphing is that you can do equations/functions as additional traces. I do that on my temp+humidity graphs in Grafana to compute the dew point; it didn't jump out at me how to do it in 2.0's native graphing, so I owe that a few minutes at some point, but at the moment, I'm trying to button up a ton of work to roll out in a new (MSR) release.