Skip to content
  • Categories
  • Recent
  • Tags
  • Popular
  • Unsolved
Collapse
Discussion Forum to share and further the development of home control and automation, independent of platforms.
  1. Home
  2. Software
  3. Multi-System Reactor
  4. [Solved] Reactor 22067 + Hubitat / InfluxDB feed storing wrong value then stopping on specific attributes
Errors after updating to MQTTController build 25139
tunnusT
I'm running MSR build 25139 on Docker, using MQTT controller 24293, and everything working as expected. But if I try to upgrade to MQTTController build 25139, I'm getting the following errors on MSR UI: An Entity Attribute condition in "Lay-Z-Spa auto heating off" (Terrace) failed because the referenced entity "Lay-Z-Spa States" (mqtt>layzspa_states) does not have attribute value_sensor.god Last 11:20:37 An Entity Attribute condition in "Lay-Z-Spa auto heating off" (Terrace) failed because the referenced entity "Lay-Z-Spa States" (mqtt>layzspa_states) does not have attribute temperature_sensor.green Last 11:20:37 An Entity Attribute condition in "Lay-Z-Spa filter pump auto off" (Terrace) failed because the referenced entity "Lay-Z-Spa States" (mqtt>layzspa_states) does not have attribute temperature_sensor.red Last 11:20:37 An Entity Attribute condition in "Lay-Z-Spa filter pump auto run" (Terrace) failed because the referenced entity "Lay-Z-Spa States" (mqtt>layzspa_states) does not have attribute value_sensor.pump Last 11:20:37 An Entity Attribute condition in "Lay-Z-Spa watchdog" (Terrace) failed because the referenced entity "Lay-Z-Spa States" (mqtt>layzspa_states) does not have attribute value_sensor.status Last 11:20:37 My MQTT configuration (local_mqtt_devices.yaml) for the related entity is: layzspa_message: type: ValueSensor capabilities: ["temperature_sensor", "value_sensor", "power_sensor"] primary_attribute: power_sensor.value events: "layzspa/message": "power_sensor.value": json_payload: true if_expr: '! isnull( payload?.PWR )' expr: "float(payload.PWR)" "value_sensor.air": json_payload: true if_expr: '! isnull( payload?.AIR )' expr: "float(payload.AIR)" "value_sensor.pump": json_payload: true if_expr: '! isnull( payload?.FLT )' expr: "float(payload.FLT)" "value_sensor.god": json_payload: true if_expr: '! isnull( payload?.GOD )' expr: "float(payload.GOD)" "value_sensor.lock": json_payload: true if_expr: '! isnull( payload?.LCK )' expr: "float(payload.LCK)" "value_sensor.unit": json_payload: true if_expr: '! isnull( payload?.UNT )' expr: "float(payload.UNT)" "value_sensor.error": json_payload: true if_expr: '! isnull( payload?.ERR )' expr: "float(payload.ERR)" "temperature_sensor.green": json_payload: true if_expr: '! isnull( payload?.GRN )' expr: "float(payload.GRN)" "temperature_sensor.red": json_payload: true if_expr: '! isnull( payload?.RED )' expr: "float(payload.RED)" "temperature_sensor.target": json_payload: true if_expr: '! isnull( payload?.TGT )' expr: "float(payload.TGT)" "temperature_sensor.value": json_payload: true if_expr: '! isnull( payload?.TMP )' expr: "float(payload.TMP)" "temperature_sensor.virtual": json_payload: true if_expr: '! isnull( payload?.VTM )' expr: "round(float(payload.VTM), 1)" "temperature_sensor.ambient": json_payload: true if_expr: '! isnull( payload?.AMB )' expr: "float(payload.AMB)" "layzspa/Status": "value_sensor.status": if_expr: '! isnull( payload )' expr: "payload" "layzspa/button": "value_sensor.button": if_expr: '! isnull( payload )' expr: "payload" and in reactor.yaml I have: "layzspa_states": name: "Lay-Z-Spa States" friendly_name: 'Lay-Z-Spa States' include: layzspa_message I realize my MQTT configuration might be a bit unorthodox, but could there still be something unintentional in the latest MQTTController build? If needed, I can provide detailed logs.
Multi-System Reactor
🎉 My very first MSR controller: OpenSprinkler
therealdbT
Since today is my birthday - and I still pretend to be unconventional - I'm giving away a present to this wonderful community and I'm releasing my first OpenSprinkler controller for MSR. It was real fun to code it - and while it's still WIP, it seems to work OK for me. It's polling-based at the moment, but I'll add support for updates via MQTT very soon (it's already partially coded). Get it at (install is similar to MQTTController and such): https://github.com/dbochicchio/reactor-opensprinkler Feel free to try it. It's beta software, but it's stable. I'll update it weekly until all the tasks from my todo list are empty. Since I've learnt a lot from this controller, I'll explore new controllers soon.
Multi-System Reactor
Set Reaction > Script Action
wmarcolinW
Topic thumbnail image
Multi-System Reactor
Advice reqeusted to migrate MSR from Bare Metal to Container
T
Good day all, I'm in the process of trying to shut down my 10 year old Linux home server that served many purposes, but primarily it's what I used for my NAS/Plex Media server. I migrated the NAS aspect of the server in November of last year to a true NAS solution (Ubiquti UNAS Pro), which is rack mount and much more efficient than my old tower, which it's only side benefit was heating my home office during the winter. Unfortunately it also means heating my home office during the summer, which were about to be in full swing. I have two things running on this 10 year old server at this point. MSR and pi-hole. I'm running Plex Media Server on Fedora Workstation in Podman on mini PC, which is much more energy efficient than my old tower. My next step is to migrate MSR. I know there are images of MSR out there, and creating it is well documented. I'm going to be using Podman instead of Docker for various reasons, but they work very similar. What I don't know, is what I need to do to migrate my existing Bare Metal installation over to a container. Has anyone done this? Any advice?
Multi-System Reactor
Reactor (Multi-System/Multi-Hub) Announcements
toggledbitsT
Build 21228 has been released. Docker images available from DockerHub as usual, and bare-metal packages here. Home Assistant up to version 2021.8.6 supported; the online version of the manual will now state the current supported versions; Fix an error in OWMWeatherController that could cause it to stop updating; Unify the approach to entity filtering on all hub interface classes (controllers); this works for device entities only; it may be extended to other entities later; Improve error detail in messages for EzloController during auth phase; Add isRuleSet() and isRuleEnabled() functions to expressions extensions; Implement set action for lock and passage capabilities (makes them more easily scriptable in some cases); Fix a place in the UI where 24-hour time was not being displayed.
Multi-System Reactor
Can´t restart or upgrade/deploy MSR
F
Topic thumbnail image
Multi-System Reactor
[Solved] Limit HA Entity in MSR
wmarcolinW
Topic thumbnail image
Multi-System Reactor
Organizing/ structuring rule sets and rules
R
Hi guys, Just wondering how you guys organize your rule sets and rules. I wish I had an extra layer to have some more granularity, but my feature request was not popular. Maybe there are better ways to organize my rule sets. I use the rule sets now primarily for rooms. So a rule set per room. But maybe grouping by functionality works better. Any examples/ suggestions would be appreciated.
Multi-System Reactor
Moving MSR from a QNAP container to RP 5 - some issues
Tom_DT
Topic thumbnail image
Multi-System Reactor
Widget deletion does not work and landing page (status) is empy
M
Topic thumbnail image
Multi-System Reactor
Need help reducing false positive notifications
T
Topic thumbnail image
Multi-System Reactor
Deleting widgets
tunnusT
Hopefully a trivial question, but how do you delete widgets in a status page? Using build 22266
Multi-System Reactor
MQTT configuration question
tunnusT
I have the following yaml configuration in local_mqtt_devices file x_mqtt_device: set_speed: arguments: speed: type: str topic: "command/%friendly_name%" payload: type: json expr: '{ "fan": parameters.speed }' While this works fine, I'm wondering how this could be changed to "fixed" parameters, as in this case "fan" only accepts "A", "Q" or a numeric value of 1-5?
Multi-System Reactor
System Configuration Check - time is offset
F
Hi! I get this message when I'm on the status tab: System Configuration Check The time on this system and on the Reactor host are significantly different. This may be due to incorrect system configuration on either or both. Please check the configuration of both systems. The host reports 2025-04-01T15:29:29.252Z; browser reports 2025-04-01T15:29:40.528Z; difference 11.276 seconds. I have MSR installed as a docker on my Home Assistant Blue / Hardkernel ODROID-N2/N2+. MSR version is latest-25082-3c348de6. HA versions are: Core 2025.3.4 Supervisor 2025.03.4 Operating System 15.1 I have restarted HA as well as MSR multiple times. This message didn´t show two weeks ago. Don´t know if it have anything to do with the latest MSR version. Do anyone know what I can try? Thanks in advance! Let's Be Careful Out There (Hill Street reference...) /Fanan
Multi-System Reactor
Programmatically capture HTTP Request action status code or error
therealdbT
I have a very strange situation, where if InfluxDB restarts, other containers may fail when restarting at the same time (under not easy to understand circumstances), and InfluxDB remains unreachable (and these containers crashes). I need to reboot these containers in an exact order, after rebooting InfluxDB. While I understand what's going on, I need a way to reliable determine that InfluxDB is not reachable and these containers are not reachable, in order to identify this situation and manually check what's going on - and, maybe, in the future, automatically restart them if needed. So, I was looking at HTTP Request action, but I need to capture the HTTP response code, instead of the response (becase if ping is OK, InfluxDB will reply with a 204), and, potentially, a way to programmatically detect that it's failing to get the response. While I could write a custom HTTP controller for this or a custom HTTP virtual device, I was wondering if this is somewhat on you roadmap @toggledbits Thanks!
Multi-System Reactor
ZwaveJSUI - RGBWW BULB - Warm/Cold White interfered with RGB settings - Bulb doesn't change color if in WarmWhite state.
N
Hi , I'm on -Reactor (Multi-hub) latest-25067-62e21a2d -Docker on Synology NAS -ZWaveJSUI 9.31.0.6c80945 Problem with ZwaveJSUI: When I try to change color to a bulb RGBWW, it doesn't change to the RGB color and the bulb remains warm or cold white. I tryed with Zipato RGBW Bulb V2 RGBWE2, Hank Bulb HKZW-RGB01, Aentec 6 A-ZWA002, so seems that it happens with all RGBWW bulb with reactor/zwavejsui. I'm using from reator the entity action: "rgb_color.set" and "rgb_color.set_rgb". After I send the reactor command, It changes in zwavejsui the rgb settings but doesn't put the white channel to "0", so the prevalent channel remains warm/cold White and the bulb doesn't change into the rgb color. This is the status of the bulb in zwavejsui after "rgb_color.set" (235,33,33,) and the bulb is still warmWhite. x_zwave_values.Color_Switch_currentColor={"warmWhite":204,"coldWhite":0,"red":235,"green":33,"blue":33} The "cold white" and "warm white" settings interfer with the rgb color settings. Reactor can change bulb colors with rgb_color set — (value, ui8, 0x000000 to 0xffffff) or rgb_color set_rgb — (red, green, blue, all ui1, 0 to 255) but if warm or cold white are not to "0", zwavejsui doesn't change them and I can't find a way to change into rgb or from rgb back to warm white. So if I use from reactor: rgb_color set_rgb — (235,33,33) in zwavejsui I have x_zwave_values.Color_Switch_targetColor={"red":235,"green":33,"blue":33} 14/03/2025, 16:43:57 - value updated Arg 0: └─commandClassName: Color Switch └─commandClass: 51 └─property: targetColor └─endpoint: 0 └─newValue └──red: 235 └──green: 33 └──blue: 33 └─prevValue └──red: 235 └──green: 33 └──blue: 33 └─propertyName: targetColor 14/03/2025, 16:43:57 - value updated Arg 0: └─commandClassName: Color Switch └─commandClass: 51 └─property: currentColor └─endpoint: 0 └─newValue └──warmWhite: 204 └──coldWhite: 0 └──red: 235 └──green: 33 └──blue: 33 └─prevValue └──warmWhite: 204 └──coldWhite: 0 └──red: 235 └──green: 33 └──blue: 33 └─propertyName: currentColor In zwavejsui, the bulb changes rgb set but warm White remains to "204" and the bulb remais on warm White channel bacause is prevalent on rgb set. x_zwave_values.Color_Switch_currentColor_0=204 x_zwave_values.Color_Switch_currentColor_1=0 x_zwave_values.Color_Switch_currentColor_2=235 x_zwave_values.Color_Switch_currentColor_3=33 x_zwave_values.Color_Switch_currentColor_4=33 Is it possible to targetColor also for "warmWhite" and "coldWhite" and have something similar to this? x_zwave_values.Color_Switch_targetColor={"warmWhite":0,"coldWhite":0,"red":235,"green":33,"blue":33} Thanks in advance.
Multi-System Reactor
Problem with simultaneous notifications.
T
Topic thumbnail image
Multi-System Reactor
Problem after upgrading to 25067
R
MSR had been running fine, but I decided to follow the message to upgrade to 25067. Since the upgrade, I have received the message "Controller "<name>" (HubitatController hubitat2) could not be loaded at startup. Its ID is not unique." MSR throws the message on every restart. Has anyone else encountered this problem? I am running MSR on a Raspberry Pi4 connecting to two Hubitat units over an OpenVPN tunnel. One C8 and a C8 Pro. Both are up-to-date. It appears that despite the error message that MSR may be operating properly.
Multi-System Reactor
Global expressions not always evaluated
tunnusT
Topic thumbnail image
Multi-System Reactor
[Solved] Local expression evaluation
V
Topic thumbnail image
Multi-System Reactor

[Solved] Reactor 22067 + Hubitat / InfluxDB feed storing wrong value then stopping on specific attributes

Scheduled Pinned Locked Moved Multi-System Reactor
6 Posts 2 Posters 386 Views 2 Watching
  • Oldest to Newest
  • Newest to Oldest
  • Most Votes
Reply
  • Reply as topic
Log in to reply
This topic has been deleted. Only users with topic management privileges can see it.
  • A Offline
    A Offline
    Alan_F
    wrote on last edited by Alan_F
    #1

    Reactor latest-22067 on Raspberry Pi, Influx DB 1.8, both in Docker. Controlling two separate Hubitat C7s.

    I am storing data for CPU load and free memory from the Hub Information device on the Hubitat Hub in the Influx database so that I can graph them.

    I noticed that for the last two days I was not getting the free memory on my graph. (I don't currently graph the CPU data.) When I restarted Reactor I got two data points and then nothing for a while.

    I looked at the Hubitat Hub Information device and could see the numbers changing there. I also watched the entities screen in Reactor and could see it flash green when it updated. Both the Hubitat device and the Reactor entities matched and were updating.

    However the Influx database stopped getting new data. What I see in Grafana matches what I see when I directly query the database in a terminal window, so it is not an issue with Grafana.

    The Hub Temperature data is updating in the database every time it changes. It is not one of the extra attributes that I added. It is logged as a regular temperature_sensor.

    This is the relevant portion of reactor.yaml:

          select_capabilities:   
            light_sensor: true   
            x_hubitat_Thermostat:
              attributes:
                - coolingSetpoint
                - heatingSetpoint
                - thermostatFanMode
                - thermostatMode
                - thermostatOperatingState
                - thermostatSetpoint
                - temperature
            x_hubitat_extra_attributes:
              attributes:
                - cpu5Min
                - cpuPct
                - freeMemory
            wx:
              attributes:
                - temperature
                - humidity
                - cloud_cover
    

    This chart from Grafana illustrates what is happening. The data points circled in red are the pairs of points from two restarts of Reactor. The yellow line and green line represent the two separate Hubitat hubs that I'm connected to. The blue line is the CPU temperature from one of the hubs.

    ac19c0aa-d9f5-4b82-9f8d-05d6ea2acc9e-image.png

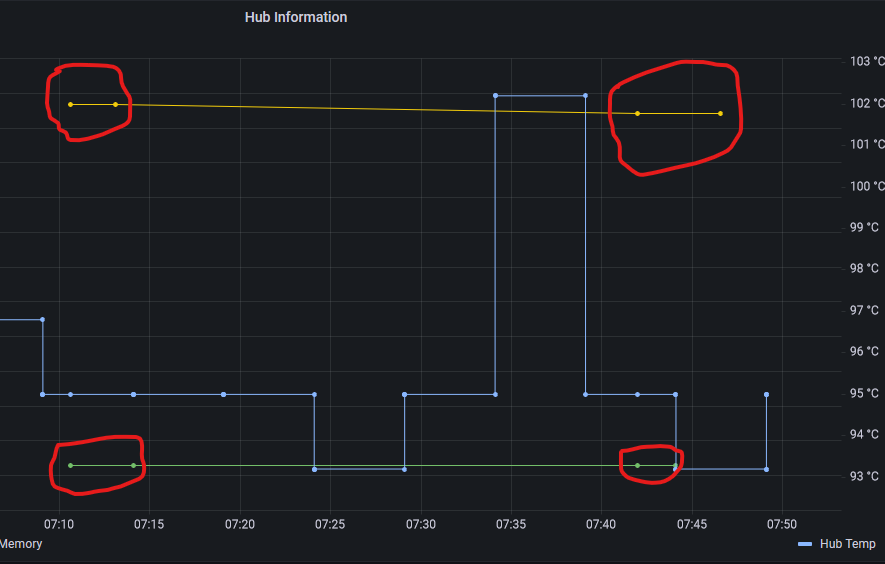
    Here is the same graph from a little later to show the CPU temp is continuing to update, but the free memory is not:

    4014600c-8501-4e58-b13c-987b5a6e9502-image.png

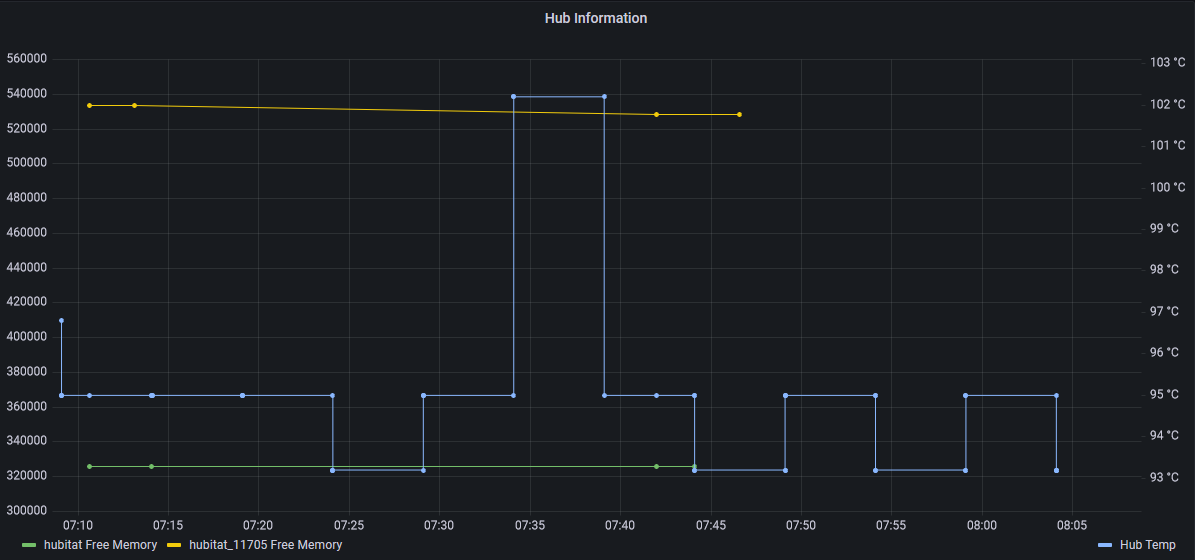
    Again, the free memory is changing in the entities screen every time it changes in the hub, but the data isn't being saved to InfluxDB after the first two data points.

    Looking at the most recent documentation, I saw the format for the attributes was different, using a trailing ":true" intead of a leading "-", so I tried switching my reactor.yaml to match. The section now reads:

        x_hubitat_extra_attributes:
          attributes:
            cpu5Min: true
            cpuPct: true
            freeMemory: true
    

    I restarted Reactor and got the same result.

    Final observation... the second data point in each pair is incorrect...

    After the last restart I pulled the data from the database.

    time                controller    cpu5Min cpuPct entity            freeMemory name
    ----                ----------    ------- ------ ------            ---------- ----
    1646918194198000000 hubitat_11705 0.07    1.75   hubitat_11705>130 526192     Hub information
    1646918045910000000 hubitat       0.23    5.75   hubitat>483       324088     Hub information
    1646918032985000000 hubitat_11705 0.07    1.75   hubitat_11705>130 526192     Hub information
    

    The first and third lines are relevant here. They are both for the 'hubitat_11705' hub. They show the free memory as 526192 on both lines.

    But when the second data point was saved to the database the reactor entity showed:

    x_hubitat_extra_attributes.freeMemory="525728"
    

    and the Hubitat device shows:

    60812ba1-6200-4e3e-8ee5-2ebb0346d487-image.png

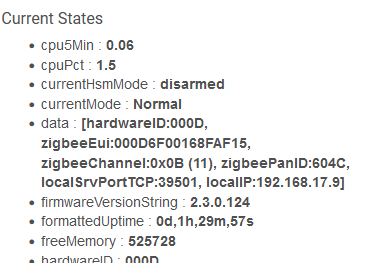
    So the second data point should have been saved in the database as '525728' but instead it saved the previous value of 526192.

    Looking back at the annotated Grafana graph I can see the same thing happened with the earlier pairs of points... the second point was the same value as the first, and then there was no more data logged until the next Reactor restart.

    1 Reply Last reply
    0
    • toggledbitsT Offline
      toggledbitsT Offline
      toggledbits
      wrote on last edited by
      #2

      Checking the logs would be useful here (again: not seeing what you expect? Look at the logs.). Also you haven't shown your queries in Grafana. If you've got mean() or other aggregates in the query, or anything in group by, the presentation is not a representation of the raw feed. Remove all aggregates and groups to make sure you are looking at the raw data. Can be very confusing otherwise. On the road, won't be much responding to this more until I return around 3/20.

      Author of Multi-system Reactor and Reactor, DelayLight, Switchboard, and about a dozen other plugins that run on Vera and openLuup.

      A 1 Reply Last reply
      0
      • toggledbitsT toggledbits

        Checking the logs would be useful here (again: not seeing what you expect? Look at the logs.). Also you haven't shown your queries in Grafana. If you've got mean() or other aggregates in the query, or anything in group by, the presentation is not a representation of the raw feed. Remove all aggregates and groups to make sure you are looking at the raw data. Can be very confusing otherwise. On the road, won't be much responding to this more until I return around 3/20.

        A Offline
        A Offline
        Alan_F
        wrote on last edited by
        #3

        @toggledbits I wasn't expecting a reply until you got back from vacation and handled other higher priority things, but I'll try to add the additional information now:

        What I'm expecting is that each time the data on the Hubitat Hub Information device changes, that the values for that I added in my reactor.yaml file (cpu5Min, cpuPct, freeMemory) will be written to the influx database. This is what it was doing up until two days ago, and I think the change in behavior matches up to when I upgraded to 22067.

        The Grafana queries are not using aggregates, nor was the direct query I ran from Influx via the command line, but I should have posted the query I used to pull the data. Here is data I just pulled directly from Influx using a command prompt, filtering on only one hub to make it simpler:

        > select * from x_hubitat_extra_attributes where entity = 'hubitat>483' order by time desc limit 6
        name: x_hubitat_extra_attributes
        time                controller cpu5Min cpuPct entity      freeMemory name
        ----                ---------- ------- ------ ------      ---------- ----
        1646918045910000000 hubitat    0.23    5.75   hubitat>483 324088     Hub information
        1646918032714000000 hubitat    0.23    5.75   hubitat>483 324088     Hub information
        1646916245576000000 hubitat            3      hubitat>483 325848     Hub information
        1646916119494000000 hubitat            3      hubitat>483 325848     Hub information
        1646914445106000000 hubitat    0.11    2.75   hubitat>483 325904     Hub information
        1646914238104000000 hubitat    0.11    2.75   hubitat>483 325904     Hub information
        

        Starting from the bottom of the list with the oldest two records, they are about 4 minutes apart but show the exact same numbers.

        The next two records again are about 4 minutes apart and show the same numbers.

        The top two records are about 1 minute apart and show the same numbers.

        Between each pair of logged values I restarted Reactor. On the last set - the top two in this list - I was watching the Reactor Entities screen and saw that the Hub Information entity updated at the time the last data point was stored, but the values were NOT 0.23, 5.75, and 324088.

        I can upload logs when you get back. I looked at the times in the log when this data was stored and I don't see anything related to Influx. I do see the updates coming from the Hub Information device.

        I was able to find the logs corresponding to the two records in the middle (showing 325848 as the freeMemory)

        The timestamp on the older one converts to: Thursday, March 10, 2022 12:41:59.494 PM

        In the logs I find the value for the freeMemory a few minutes earlier at 12:39:05Z. I think the time discrepancy is because I restarted Reactor between when the value was logged and when it got written to the database. When Reactor started up, it wrote the most recent value to Influx.

        [latest-22067]2022-03-10T12:39:05.568Z <HubitatController#hubitat:5:HubitatController.js:641> HubitatController#hubitat received DEVICE event [Object]{ "source": "DEVICE", "name": "freeMemory", "displayName": "Hub information", "value": "325848", "type": "null", "unit": "KB", "deviceId": 483, "hubId": 0, "installedAppId": 0, "descriptionText": "null" }
        [latest-22067]2022-03-10T12:39:05.569Z <HubitatController#hubitat:INFO> HubitatController#hubitat fast update Entity#hubitat>483 event freeMemory="325848"
        [latest-22067]2022-03-10T12:39:05.569Z <HubitatController#hubitat:INFO> HubitatController#hubitat fast update Entity#hubitat>483 event freeMemory="325848"


        The next record from the database with the same values has a timestamp that converts to Thursday, March 10, 2022 12:44:05.576 PM

        That matches up in the logs with this:

        [latest-22067]2022-03-10T12:44:05.632Z <HubitatController#hubitat:5:HubitatController.js:641> HubitatController#hubitat received DEVICE event [Object]{ "source": "DEVICE", "name": "freeMemory", "displayName": "Hub information", "value": "325884", "type": "null", "unit": "KB", "deviceId": 483, "hubId": 0, "installedAppId": 0, "descriptionText": "null" }
        [latest-22067]2022-03-10T12:44:05.633Z <HubitatController#hubitat:5:HubitatController.js:643> HubitatController#hubitat ws DEVICE event device 483 freeMemory="325884"
        [latest-22067]2022-03-10T12:44:05.633Z <HubitatController#hubitat:INFO> HubitatController#hubitat fast update Entity#hubitat>483 event freeMemory="325884"
        

        So at 12:44:05 I'm expecting the freeMemory written to the database to be 325884, but the database query returned 325848, the previous value from a few minutes earlier in the logs.

        The next instance of the hub freeMemory in the logs is at 12:49:05Z

        [latest-22067]2022-03-10T12:49:05.763Z <HubitatController#hubitat:5:HubitatController.js:641> HubitatController#hubitat received DEVICE event [Object]{ "source": "DEVICE", "name": "freeMemory", "displayName": "Hub information", "value": "325664", "type": "null", "unit": "KB", "deviceId": 483, "hubId": 0, "installedAppId": 0, "descriptionText": "null" }
        [latest-22067]2022-03-10T12:49:05.764Z <HubitatController#hubitat:5:HubitatController.js:643> HubitatController#hubitat ws DEVICE event device 483 freeMemory="325664"
        [latest-22067]2022-03-10T12:49:05.765Z <HubitatController#hubitat:INFO> HubitatController#hubitat fast update Entity#hubitat>483 event freeMemory="325664"
        

        There is no corresponding record in the Influx database. I would expect an entry with freeMemory of 325664.

        There are additional logs showing the Hubitat Hub Information device updating values every few minutes, but nothing was added to the database until after 1:13:52Z when I restarted Reactor. Then I got the two entries showing a freeMemory of 324088, but as with the middle two record in the query results, the second one of the pair is wrong. The last (top of the list) data in the database shows freeMemory of 324088 and its timestamp converts to Thursday, March 10, 2022 1:14:05.910 PM

        The log shows:

        [latest-22067]2022-03-10T13:14:05.943Z <HubitatController#hubitat:5:HubitatController.js:641> HubitatController#hubitat received DEVICE event [Object]{ "source": "DEVICE", "name": "freeMemory", "displayName": "Hub information", "value": "323712", "type": "null", "unit": "KB", "deviceId": 483, "hubId": 0, "installedAppId": 0, "descriptionText": "null" }
        [latest-22067]2022-03-10T13:14:05.945Z <HubitatController#hubitat:5:HubitatController.js:643> HubitatController#hubitat ws DEVICE event device 483 freeMemory="323712"
        [latest-22067]2022-03-10T13:14:05.945Z <HubitatController#hubitat:INFO> HubitatController#hubitat fast update Entity#hubitat>483 event freeMemory="323712"
        

        I would have expected the database entry at 13:14:05Z to show 323712 as the freeMemory value.

        I haven't restarted Reactor since then, and as I type this several hours later, no new data for these attributes has made it into the database.

        1 Reply Last reply
        0
        • toggledbitsT Offline
          toggledbitsT Offline
          toggledbits
          wrote on last edited by toggledbits
          #4

          I'm not quite out the door yet; I was just leaving ample room for packing, and whatever support my older son needed for a final exam he was taking today.

          So I see two things contributing here:

          1. There is an opportunity for a value change that occurs during a loss of connection to the hub and a reconnect to be missed; that is, if Reactor stays running, but the hub is rebooted, Reactor may miss a value that changes (and free memory would almost certainly change there). This would be due to the new fast update behavior, so a new issue. That will take a code fix, which I can safely and quickly make in the next hour or so.

          2. The event websocket is sending all values for updated (Hubitat) attributes as strings. That's disappointing. That will make InfluxDB choke, because the values given by Maker API, which are the first values inserted into the database, will be numbers, thereby cementing the type for that field in InfluxDB. Thereafter, the attempt to insert a string will fail because the data types don't match. This is a chronic InfluxDB problem, and I actually made some code changes to the integration about a month ago to help get around that problem when it comes up. So, you will need to modify your InfluxDB plugin config to look more like this:

                  x_hubitat_extra_attributes:
                    attributes:
                      cpu5Min:
                        type: number
                      cpuPct:
                        type: number
                      freeMemory:
                        type: number
                      uptime:
                        type: number
          

          This will make the plugin coerce (if it can) each value to its "proper" type before handing it off to InfluxDB. You can do this now, and it should have an immediate effect on your updates. The code change mentioned above (item 1) handles a rarer circumstance that you could also see, but is probably not the major contributor to what is going on for you today. Try this change out, and see if it helps. I expect it will. If so, you may want to consider adding this to other attributes being exported to InfluxDB.

          I can do more in HubitatController to make sure the types are properly converted when they come in from the event websocket, but that's a bigger change that I'm reticent to make right now. The code change to fix the restart update is small, so I'm more confident in making that change today, but I'll leave the rest for later. The type configuration should work around that issue pretty effectively until I get back.

          Author of Multi-system Reactor and Reactor, DelayLight, Switchboard, and about a dozen other plugins that run on Vera and openLuup.

          1 Reply Last reply
          0
          • A Offline
            A Offline
            Alan_F
            wrote on last edited by
            #5

            Just realized I was only looking in the Hubitat.log file, which we turned on while trying to troubleshoot something else, and not in the reactor.log file... Ugh... need more coffee before trying to troubleshoot. Apologies for making this more difficult by missing that. In the reactor.log files I found the Influx errors saying that the database field was type 'float' and the data from the hub was 'string'. If I had posted that at the top of this thread, it would be a much shorter read.

            After changing the attributes as you showed above I'm now getting correct data into the database and I'm not seeing errors in reactor.log.

            1 Reply Last reply
            0
            • toggledbitsT Offline
              toggledbitsT Offline
              toggledbits
              wrote on last edited by
              #6

              What you posted was great, and I was able to see the string data in the events, so clue attained, and that's a win. We'll fix it right when I get back.

              Author of Multi-system Reactor and Reactor, DelayLight, Switchboard, and about a dozen other plugins that run on Vera and openLuup.

              1 Reply Last reply
              0
              • toggledbitsT toggledbits locked this topic on
              Reply
              • Reply as topic
              Log in to reply
              • Oldest to Newest
              • Newest to Oldest
              • Most Votes


              Recent Topics

              • Wiring Samotech SM308-S into light fitting
                akbooerA
                akbooer
                0
                2
                32

              • Errors after updating to MQTTController build 25139
                toggledbitsT
                toggledbits
                0
                6
                60

              • 🎉 My very first MSR controller: OpenSprinkler
                therealdbT
                therealdb
                5
                13
                628

              • Set Reaction > Script Action
                toggledbitsT
                toggledbits
                0
                4
                56

              • Advice reqeusted to migrate MSR from Bare Metal to Container
                T
                tamorgen
                0
                5
                91

              • Reactor (Multi-System/Multi-Hub) Announcements
                toggledbitsT
                toggledbits
                5
                122
                37.3k

              • Z-Wave Future....
                CatmanV2C
                CatmanV2
                0
                5
                171

              • Can´t restart or upgrade/deploy MSR
                toggledbitsT
                toggledbits
                0
                4
                127

              • [Solved] Limit HA Entity in MSR
                wmarcolinW
                wmarcolin
                0
                7
                250

              • Disaster recovery and virtualisation
                CatmanV2C
                CatmanV2
                0
                5
                693

              • Remote access of Zwave stick from Z-wave server
                CatmanV2C
                CatmanV2
                0
                3
                415
              Powered by NodeBB | Contributors
              Hosted freely by 10RUPTiV - Solutions Technologiques | Contact us
              • Login

              • Don't have an account? Register

              • Login or register to search.
              • First post
                Last post
              0
              • Categories
              • Recent
              • Tags
              • Popular
              • Unsolved